I-jet — Trace
The Trace options specify the trace behavior for I-jet.
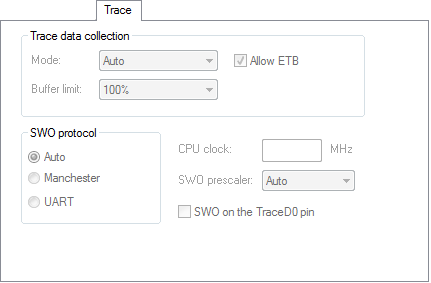
Mode
Power measurement (either TrgPwr as provided by the probe or via I-scope) does not depend on a particular trace mode and is always possible (if the probe supports it).
The Debug Log window will include messages about the currently used trace mode. If a particular mode cannot be used, either due to probe or board/device limitations, trace will be disabled and a warning message will be displayed in the Debug Log window. This is how the support of a particular trace mode is checked:
The probe must support the particular mode.
The probe must support the particular mode on a specific core. For example, ETM on Arm9 is not supported by the I-jet Trace probe.
The specific core must support the particular mode. For example, Cortex-M0 does not support SWO/ETM/ETB at all and Arm9 does not support SWO.
The used adapter must support the specified mode. For example, ETM trace is not possible when the Arm20 adapter is used with I-jet Trace.
The specific device must support the particular mode. For example, ETM trace is not possible on a Cortex-M3 without ETM, which cannot be detected until reading the on-chip TPIU configuration register.
The Mode option specifies the mechanism and interface for trace data collection. Choose between:
- Auto
Automatically selects the best possible mechanism and interface, depending on probe and board/device capabilities.
The basic modes are tried in probe-dependent order:
I-jet—first SWO, then ETB (ETM is not supported).
I-jet Trace—first ETM, then SWO, then ETB.
If none of these modes are available, trace will be disabled (as when None is selected). In Auto mode, more initial accesses to trace-related on-chip resources might be made. So, if you are using a specific probe and a specific mode, you might want to set the mode explicitly which will make C-SPY initialize/configure trace resources more efficiently.
- None
Disables trace. In this mode, C-SPY will not access any trace-related on-chip resources. You can use this mode when:
You are experiencing connectivity problems. It might be easier to diagnose the reason for connectivity problems without the interference from initialization of trace resources.
Trace might change some internal clocking and/or GPIO mux settings and as a result some applications might not work well with a specific trace mode.
You want to exercise low-power modes. Internal on-chip trace logic and toggling trace pins will require some additional current and it might interfere with low-power measurements. In extreme cases, enabling clocks for trace/GPIO might prevent the CPU from actually entering low-power modes, because some clocks inside the CPU must be kept active.
- Serial (SWO)
Collects trace data through the serial (SWO) interface.
- Parallel (ETM)
Collects trace data through the parallel (ETM) interface.
- On-chip (ETB/MTB)
Collects trace data through the on-chip (ETB/MTB) interface.
Allow ETB
Allows simultaneous on-chip (ETB) trace. This option is only available when Mode is Serial (SWO).
Buffer limit
Limits probe memory use. This option is only available if parallel (ETM) mode is used, either explicitly through Parallel (ETM) or implicitly through Auto.
Collected trace data is stored in probe memory.
Because reading and decoding large amounts of trace data takes time, it is possible to limit what portion of ETM memory will actually be read by C-SPY once trace data collection is stopped (either because the CPU stopped or because the buffer got full). Using the Buffer limit option limits the buffer use to a percentage of the total memory size. Using more probe memory yields more trace data, but will take longer to see results and use up more host memory. C-SPY will retrieve the most recent samples from the trace probe, and the rest of the collected trace data will be discarded.
There is no simple correlation between the number of raw ETM samples and the number of PC samples visible in the ETM Trace window. The ETM protocol itself is highly compressed, and the probe provides additional compression of ETM idle cycles, so it is not possible to guess how many instructions can be decoded from a certain number of raw ETM samples collected by the trace probe. If your application changes PC a lot, ETM will need to use more samples to send more PC bits and as such, trace data will not compress well. For a particular application profile, this number is usually constant (between 0.5 and 2 instructions for a 4-bit sample), so you must use your own judgment to see what buffer limit that provides a good balance between the size of decoded data and C-SPY performance.
SWO protocol
Specifies the communication protocol for the SWO channel. Choose between:
- Auto
Automatically selects the best possible protocol and speed, depending on the device you are using.
- Manchester
Specifies the Manchester protocol.
- UART
Specifies the UART protocol.
CPU clock
Specifies the exact clock frequency used by the internal processor clock, HCLK, in MHz. The value can have decimals. This value is used for configuring the SWO communication speed and for calculating timestamps.
SWO prescaler
Specifies the clock prescaler of the SWO communication channel in KHz. The prescaler, in turn, determines the SWO clock frequency.
Auto automatically uses the highest possible frequency that the I-jet or I-jet Trace debug probe can handle. Use this setting if data packets are lost during transmission.
To override the SWO clock setup options, use the Override project default option in the SWO Configuration dialog box, see SWO Configuration dialog box.