Disassembly window
What do you want to do?
Learn about:
Get reference information about the Disassembly window, see below the line.

The C-SPY Disassembly window is available from the View menu.
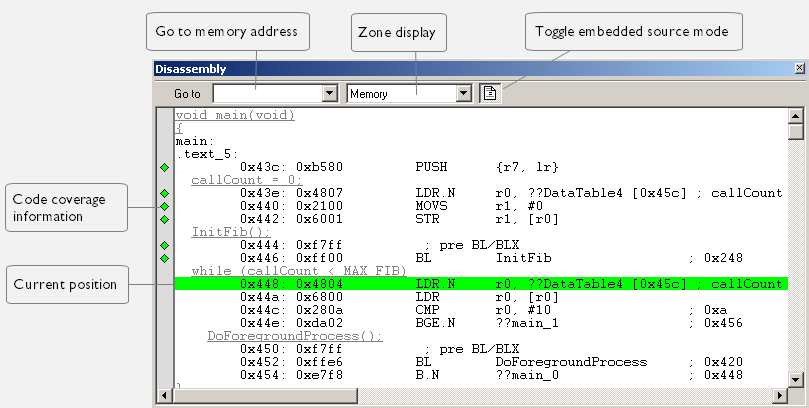
This window shows the application being debugged as disassembled application code.
Choose Tools>Options>Debugger.
Set the default color using the Source code color in disassembly window option.
Tip
To view the corresponding assembler code for a function, you can select it in the editor window and drag it to the Disassembly window.
Context menu
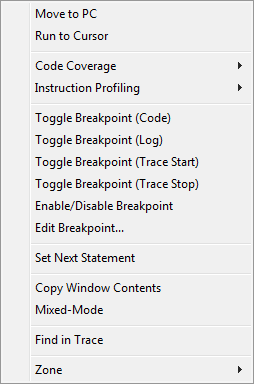
This context menu is available:
Note
The contents of this menu are dynamic, which means that the commands on the menu might depend on your product package.
These commands are available:
- Move to PC
Displays code at the current program counter location.
- Run to Cursor
Executes the application from the current position up to the line containing the cursor.
- Code Coverage
Displays a submenu that provides commands for controlling code coverage. This command is only enabled if the driver you are using supports it.
Enable
Toggles code coverage on or off.
Show
Toggles the display of code coverage on or off. Code coverage is indicated by a red, green, and red/yellow diamonds in the left margin.
Clear
Clears all code coverage information.
Next Different Coverage >
Moves the insertion point to the next line in the window with a different code coverage status than the selected line.
Previous Different Coverage <
Moves the insertion point to the closest preceding line in the window with a different code coverage status than the selected line.
- Instruction Profiling
Displays a submenu that provides commands for controlling instruction profiling. This command is only enabled if the driver you are using supports it.
Enable
Toggles instruction profiling on or off.
Show
Toggles the display of instruction profiling on or off. For each instruction, the left-side margin displays how many times the instruction has been executed.
Clear
Clears all instruction profiling information.
- Toggle Breakpoint (Code)
Toggles a code breakpoint. Assembler instructions and any corresponding label at which code breakpoints have been set are highlighted in red. For more information, see Code breakpoints dialog box.
- Toggle Breakpoint (Log)
Toggles a log breakpoint for trace printouts. Assembler instructions at which log breakpoints have been set are highlighted in red. For more information, see Log breakpoints dialog box.
- Toggle Breakpoint (Trace Start)
Toggles a Trace Start breakpoint. When the breakpoint is triggered, the trace data collection starts. Note that this menu command is only available if the C-SPY driver you are using supports trace. For more information, see Trace Start Trigger breakpoint dialog box.
- Toggle Breakpoint (Trace Stop)
Toggles a Trace Stop breakpoint. When the breakpoint is triggered, the trace data collection stops. Note that this menu command is only available if the C-SPY driver you are using supports trace. For more information, see Trace Stop Trigger breakpoint dialog box.
- Enable/Disable Breakpoint
Enables and Disables a breakpoint. If there is more than one breakpoint at a specific line, all those breakpoints are affected by the Enable/Disable command.
- Edit Breakpoint
Displays the breakpoint dialog box to let you edit the currently selected breakpoint. If there is more than one breakpoint on the selected line, a submenu is displayed that lists all available breakpoints on that line.
- Set Next Statement
Sets the program counter to the address of the instruction at the insertion point.
- Copy Window Contents
Copies the selected contents of the Disassembly window to the clipboard.
- Mixed-Mode
Toggles between showing only disassembled code or disassembled code together with the corresponding source code. Source code requires that the corresponding source file has been compiled with debug information.
- Find in Trace
Searches the contents of the Trace window for occurrences of the given location—the position of the insertion point in the source code—and reports the result in the Find in Trace window. This menu command requires support for Trace in the C-SPY driver you are using, see Differences between the C-SPY drivers.
- Zone
Selects a memory zone, see C-SPY memory zones.