Memory window
What do you want to do?
Learn about:
Learn how to:
Get reference information about the Memory window, see below the line.

The Memory window is available from the View menu.
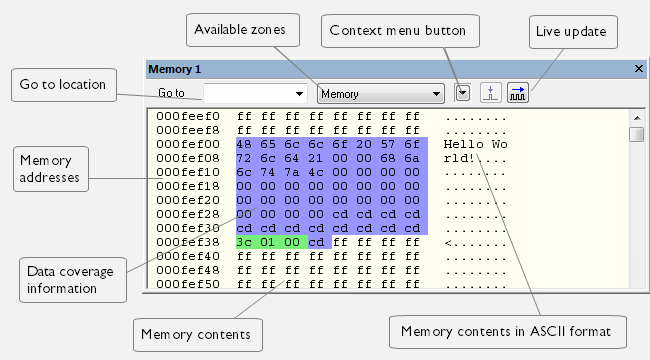
This window gives an up-to-date display of a specified area of memory—a memory zone—and allows you to edit it. You can open several instances of this window, which is very convenient if you want to keep track of several memory or register zones, or monitor different parts of the memory.
Tip
To view the memory corresponding to a variable, you can select it in the editor window and drag it to the Memory window.
Context menu
This context menu is available:
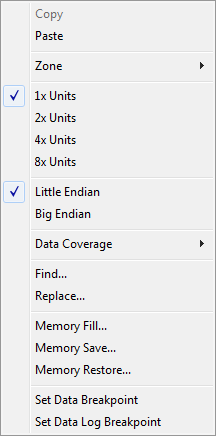
These commands are available:
- Copy, Paste
Standard editing commands.
- Zone
Selects a memory zone, see C-SPY memory zones.
- 1x Units
Displays the memory contents as single bytes.
- 2x Units
Displays the memory contents as 2-byte groups.
- 4x Units
Displays the memory contents as 4-byte groups.
- Find
Displays a dialog box where you can search for text within the Memory window—read about the Find dialog box in Find dialog box.
- Replace
Displays a dialog box where you can search for a specified string and replace each occurrence with another string—read about the Replace dialog box in Replace dialog box.
- Memory Fill
Displays a dialog box, where you can fill a specified area with a value, see Fill dialog box.
- Memory Save
Displays a dialog box, where you can save the contents of a specified memory area to a file, see Memory Save dialog box.
- Memory Restore
Displays a dialog box, where you can load the contents of a file in Intel-hex or Motorola s-record format to a specified memory zone, see Memory Restore dialog box.
- Set Data Breakpoint
Sets breakpoints directly in the Memory window. The breakpoint is not highlighted—you can see, edit, and remove it in the breakpoint dialog box. The breakpoints you set in this window will be triggered for both read and write access. For more information, see Setting a data breakpoint in the Memory window.
- Set Data Log Breakpoint
Sets a breakpoint on the start address of a memory selection directly in the Memory window. The breakpoint is not highlighted—you can see, edit, and remove it in the breakpoint dialog box. The breakpoints you set in this window will be triggered by both read and write accesses—to change this, use the Breakpoints window. For more information, see Data Log breakpoints and Getting started using data logging.