Power Log window
What do you want to do?
Learn about:
Learn how to:
Get related information:
Get reference information about the Power Log window, see below the line.

The Power Logwindow is available from the C-SPY driver menu during a debug session.
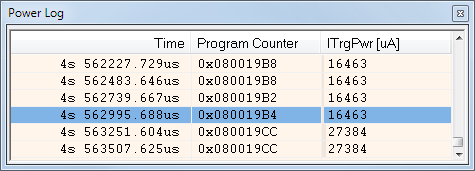
This window displays collected power values.
A row with only Time/Cycles displayed in pink denotes a logged power value for a channel that was active during the actual collection of data but currently is disabled in the Power Log Setup window.
Note
There is a limit on the number of saved logs. When this limit is exceeded, the oldest entries in the buffer are erased.
Context menu
This context menu is available:
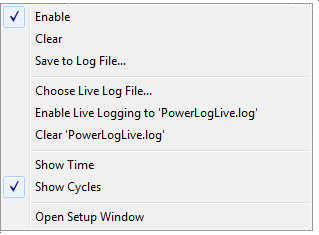
These commands are available:
- Enable
Enables the logging system, which means that power values are saved internally within the IDE. The values are displayed in the Power Log window and in the Power graph in the Timeline window (if enabled). The system will log information also when the window is closed.
- Clear
Deletes the log information. Note that this will also happen when you reset the debugger, or if you change the execution frequency in the SWO Configuration dialog box.
- Save to File
Displays a standard file selection dialog box where you can select the destination file for the log information. The entries in the log file are separated by
TABandLFcharacters. An X in the Approx column indicates that the timestamp is an approximation.
- Choose Live Log File
Displays a standard file selection dialog box where you can choose a destination file for the logged power values. The power values are continuously saved to that file during execution. The content of the live log file is never automatically cleared, the logged values are simply added at the end of the file.
- Enable Live Logging to
Toggles live logging on or off. The logs are saved in the specified file.
- Clear log file
Clears the content of the live log file.
- Show Time
Displays the Time column. If the Time column is displayed by default in the C-SPY driver you are using, this menu command is not available.
- Show Cycles
Displays the Cycles column. If the Cycles column is not supported in the C-SPY driver you are using, this menu command is not available.
- Open Setup Window
Opens the Power Log Setup window.