Event Log Summary window
What do you want to do?
Learn about:
Learn how to:
Get reference information about the Event Log Summary window, see below the line.

The Event Log Summary window is available from the C-SPY driver menu.

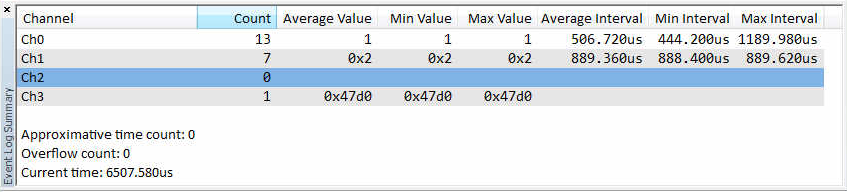
This window displays a summary of events produced when the execution passes specific positions in your application code. The Cortex ITM communication channels are used for passing the events from a running application to the C-SPY Event system.
Requirements
A Cortex device and one of these alternatives:
The C-SPY I-jet driver and an I-jet or I-jet Trace in-circuit debugging probe with an SWD interface between the debug probe and the target system
The C-SPY J-Link/J-Trace driver and a J-Link or J-Trace debug probe with an SWD interface between the debug probe and the target system
The C-SPY ST-LINK driver and an ST-LINK debug probe with an SWD interface between the debug probe and the target system
The C-SPY TI XDS driver and a TI XDS debug probe with an SWD interface between the debug probe and the target system.
Display area
Each row displays the type and the number of accesses to each location in your application code in these columns. Summary information is listed at the bottom of the display area.
- Channel
The name of the communication channel for which events are generated.
- Count
The number of logged events.
- Average Value
The average value of all received event values.
- Min Value
The smallest value of all received event values.
- Max Value
The largest value of all received event values.
- Average Interval
The average time (in cycles) between events.
- Min Interval
The shortest time (in cycles) between two events.
- Max Interval
The longest time (in cycles) between two events.
- Approximative time count
The information displayed depends on the C-SPY driver you are using.
For some C-SPY drivers, this information is not displayed or the value is always zero. In this case, all logs have an exact time stamp.
For other C-SPY drivers, a non-zero value is displayed. The value represents the amount of logs with an approximative time stamp. This might happen if the bandwidth in the communication channel is too low compared to the amount of data packets generated by the CPU or if the CPU generated packets with an approximative time stamp.
- Overflow count
The information displayed depends on the C-SPY driver you are using.
For some C-SPY drivers, this information is not displayed or the value is always zero.
For other C-SPY drivers, the number represents the amount of overflows in the communication channel which can cause logs to be lost. If this happens, it indicates that logs might be incomplete. To solve this, make sure not to use all C-SPY log features simultaneously or check used bandwidth for the communication channel.
- Current time/Current cycles
The information displayed depends on the C-SPY driver you are using.
For some C-SPY drivers, the value is always zero or not visible at all.
For other C-SPY drivers, the number represents the current time or cycles—the number of cycles or the execution time since the start of execution.
Context menu
This context menu is available:

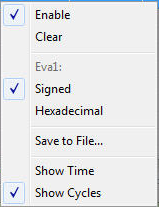
These commands are available:
- Enable
Enables the logging system. The system will log information also when the window is closed.
- Clear
Deletes the log information. Note that this will also happen when you reset the debugger.
- Variable
The name of the channel for which the Events-specific commands below apply. This menu command is context-sensitive, which means it reflects the channel in the Events graph you selected in the Timeline window (one of up to four).
- Signed
Toggles between displaying the selected value as a signed or unsigned number. Note that this setting also affects the log window.
- Hexadecimal
Toggles between displaying the selected value in decimal or hexadecimal format. Note that this setting also affects the log window.
- Save to File
Displays a standard file selection dialog box where you can select the destination file for the log information. The entries in the log file are separated by
TABandLFcharacters. An X in the Approx column indicates that the timestamp is an approximation.
- Show Time
Displays the Time column. If the Time column is displayed by default in the C-SPY driver you are using, this menu command is not available.
- Show Cycles
Displays the Cycles column. If the Cycles column is not supported in the C-SPY driver you are using, this menu command is not available.