- IAR Embedded Workbench for Arm 9.70.x
- C-SPY Debugging
- Trace
- Reference information on trace
- ETM Trace Settings dialog box (J-Link/J-Trace)
ETM Trace Settings dialog box (J-Link/J-Trace)
The ETM Trace Settings dialog box is available from the C-SPY driver menu.
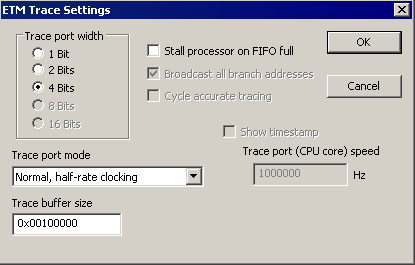
Use this dialog box to configure ETM trace generation and collection.
See also:
Requirements
The C-SPY J-Link/J-Trace driver.
Trace port width
Specifies the trace bus width, which can be set to 1, 2, 4, 8, or 16 bits. The value must correspond with what is supported by the hardware and the debug probe. For Cortex-M3, 1, 2, and 4 bits are supported by the J-Trace debug probe. For Arm7/9, only 4 bits are supported by the J-Trace debug probe.
For the lower values, the risk of FIFO buffer overflow increases, unless you are using the Stall processor on FIFO full option.
Trace port mode
Specifies the used trace clock rate:
Normal, full-rate clocking
Normal, half-rate clocking
Multiplexed
Demultiplexed
Demultiplexed, half-rate clocking
Note
For the J-Trace driver, the available alternatives depend on the device you are using.
Trace buffer size
Specify the size of the trace buffer. By default, the number of trace frames is 0xFFFF. For Arm7/9 the maximum number is 0xFFFFF, and for Cortex-M3 the maximum number is 0x3FFFFF.
For ARM7/9, one trace frame corresponds to 2 bytes of the physical J-Trace buffer size. For Cortex-M3, one trace frame corresponds to approximately 1 byte of the buffer size.
Note
The Trace buffer size option is only available for the J-Trace driver.
Cycle accurate tracing
Emits trace frames synchronous to the processor clock even when no trace data is available. This makes it possible to use the trace data for real-time timing calculations. However, if you select this option, the risk for FIFO buffer overflow increases.
Note
This option is only available for Arm7/9 devices.
Broadcast all branches
Makes the processor send more detailed address trace information. However, if you select this option, the risk for FIFO buffer overflow increases.
Note
This option is only available for Arm7/9 devices. For Cortex, this option is always enabled.
Stall processor on FIFO full
Stalls the processor in case the FIFO buffer fills up. The trace FIFO buffer on the CPU might in some situations become full—FIFO buffer overflow—which means trace data will be lost. This can be the case when the CPU is executing several branch instructions close to each other in time, such as in tight loops.
Show timestamp
Makes the Trace window display seconds instead of cycles in the Index column. To make this possible, you must also specify the appropriate speed for your CPU in the Trace port (CPU core) speed text box.
Note
This option is only available when you use the J-Trace driver with Arm7/9 devices.