Trace Filter breakpoints dialog box (I-jet)
In this section:
The Trace Filter dialog box is available from the context menu that appears when you right-click in the Breakpoints window. You can also right-click in the editor window or the Disassembly window, and then choose Toggle Breakpoint (Trace Filter).
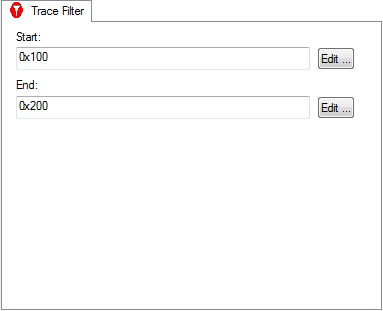
Use this dialog box to set the conditions that determine when to start collecting trace data. When the trace condition is triggered, the trace data collection is started.