- IAR Embedded Workbench for RH850 3.20.x
- C-SPY Debugging
- Analyzing code performance
- Reference information on performance analysis
- Performance Analysis Setup dialog box
Performance Analysis Setup dialog box
The Performance Analysis Setup dialog box is available from the Performance Analysis window and from the C-SPY Driver menu.
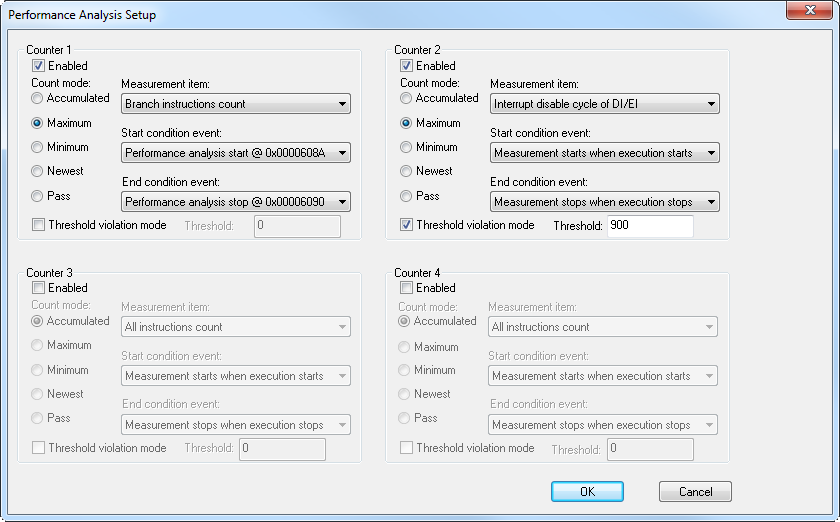
Use this dialog box to configure the analysis. You can configure up to four counters. In a multicore environment, four counters per core are available. The configuration in the dialog box applies to the currently selected core.
Requirements
A C-SPY hardware debugger driver.
Enabled
Select this check box to activate this counter.
Count mode
Most likely, the code between the start condition event and the end condition event will be executed several times. Use this option to select how to perform the measurement with regard to this. Choose between:
- Accumulated
Records the total count of the selected measurement item over all execution passes.
- Maximum
Records the count of the selected measurement item from the execution pass with the highest count.
- Minimum
Records the count of the selected measurement item from the execution pass with the lowest count.
- Newest
Records the count of the selected measurement item from the last execution pass.
- Pass
Ignores the measurement item and instead counts the number of execution passes (the number of times the code between the start condition event and the end condition event is executed).
Measurement item
Selects what to measure. Choose between:
- All instructions count
The number of times any instructions are executed.
- Branch instructions count
The number of times any instructions that trigger branching are executed.
- EI level interrupt count
The number of times
EI-level interrupts are accepted.- FE level interrupt count
The number of times
FE-level interrupts are accepted.- All instruction async exception count
The number of times any instruction-asynchronous exceptions are accepted.
- All instruction sync exception count
The number of times any instruction-synchronous exceptions are accepted.
- Clock cycle
The number of clock cycles.
- Non-interrupt cycle
The number of cycles excluding the interrupt processing.
- Interrupt disable cycle of DI/EI
The number of cycles in which
DI/EIinterrupts are disabled.- IFU instruction fetch request count
The number of instruction fetch requests issued by the Instruction Fetch Unit.
- Response count for IFU issued instruction fetch
The number of instruction cache non-wait responses for instruction fetch requests issued by the Instruction Fetch Unit.
- Flash ROM data request count
The number of flash ROM data requests.
Start condition event
The event that starts the performance measurement. Choose between:
- Measurement starts when execution starts
The counter will start the measurement when C-SPY starts executing your application.
- Performance analysis start @ address
The counter will start the measurement when the execution triggers this Performance Start breakpoint.
For information about Performance Start breakpoints, see Performance Analysis Start breakpoints dialog box.
End condition event
The event that stops the performance measurement. Choose between:
- Measurement stops when execution stops
The counter will stop the measurement when C-SPY stops executing your application.
- Performance analysis stop @ address
The counter will stop the measurement when the execution triggers this Performance Stop breakpoint.
For information about Performance Stop breakpoints, see Performance Analysis Stop breakpoints dialog box.
Threshold violation mode
Select this option to specify a maximum limit for the count. When the count value reaches this limit, the measurement stops.