Breakpoints window
What do you want to do?
Learn about:
Learn how to:
Get reference information about the Breakpoints window, see below the line.

The Breakpoints window is available from the View menu.
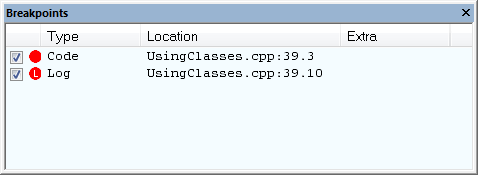
This window lists all breakpoints you define.
Use this window to conveniently monitor, enable, and disable breakpoints—you can also define new breakpoints and modify existing breakpoints.
Context menu
This context menu is available:
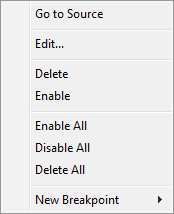
These commands are available:
- Go to Source
Moves the insertion point to the location of the breakpoint, if the breakpoint has a source location. Double-click a breakpoint in the Breakpoints window to perform the same command.
- Edit
Opens the breakpoint dialog box for the breakpoint you selected.
- Delete
Deletes the breakpoint. Press the Delete key to perform the same command.
- Enable
Enables the breakpoint. The check box at the beginning of the line will be selected. You can also perform the command by manually selecting the check box. This command is only available if the breakpoint is disabled.
- Disable
Disables the breakpoint. The check box at the beginning of the line will be deselected. You can also perform this command by manually deselecting the check box. This command is only available if the breakpoint is enabled.
- Enable All
Enables all defined breakpoints.
- Disable All
Disables all defined breakpoints.
- Delete All
Deletes all defined breakpoints.
- New Breakpoint
Displays a submenu where you can open the breakpoint dialog box for the available breakpoint types. All breakpoints you define using this dialog box are preserved between debug sessions.