Data Sample window
What do you want to do?
Learn about:
Learn how to:
Get reference information about the Data Sample window, see below the line.

The Data Sample window is available from the C-SPY driver menu.
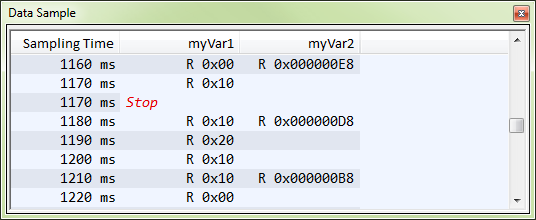
Use this window to view the result of the data sampling for the variables you have selected in the Data Sample Setup window.
Choose Enable from the context menu to enable data sampling.
Context menu
This context menu is available:
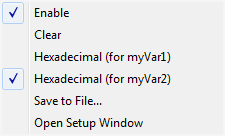
These commands are available:
- Enable
Enables data sampling.
- Clear
Clears the sampled data.
- Hexadecimal
Toggles between displaying the selected value in decimal or hexadecimal format. Note that this setting also affects the log window.
- Save to File
Displays a standard file selection dialog box where you can select the destination file for the log information. The entries in the log file are separated by
TABandLFcharacters. An X in the Approx column indicates that the timestamp is an approximation.
- Open setup window
Opens the Data Sample Setup window.