Trace Start Trigger breakpoint dialog box
What do you want to do?
Learn about:
Learn how to:
Get related information:
Get reference information about the Trace Start Trigger breakpoints dialog box, see below the line.

The Trace Start Trigger dialog box is available from the context menu that appears when you right-click in the Breakpoints window.
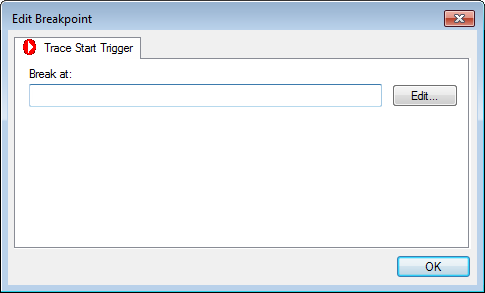
Use this dialog box to set a Trace Start Trigger breakpoint where you want to start collecting trace data. If you want to collect trace data only for a specific range, you must also set a Trace Stop Trigger breakpoint where you want to stop collecting data.
In the editor or Disassembly window, right-click and choose Trace Start Trigger from the context menu.
Alternatively, open the Breakpoints window by choosing View>Breakpoints.
In the Breakpoints window, right-click and choose New Breakpoint>Trace Start Trigger.
Alternatively, to modify an existing breakpoint, select a breakpoint in the Breakpoints window and choose Edit on the context menu.
In the Break at text box, specify an expression, an absolute address, or a source location. Click OK.
When the breakpoint is triggered, the trace data collection starts.