Breakpoint Usage window
What do you want to do?
Learn about:
Learn how to:
Get reference information about the Breakpoints Usage window, see below the line.

The Breakpoint Usage window is available from the menu specific to the C-SPY driver you are using.
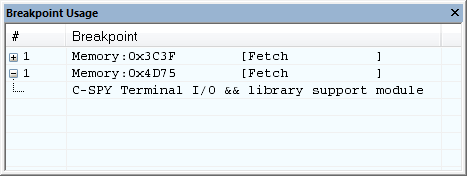
This window lists all breakpoints currently set in the target system, both the ones you have defined and the ones used internally by C-SPY. The format of the items in this window depends on the C-SPY driver you are using.
The window gives a low-level view of all breakpoints, related but not identical to the list of breakpoints displayed in the Breakpoints window.
C-SPY uses breakpoints when stepping. If your target system has a limited number of hardware breakpoints, exceeding the number of available hardware breakpoints will cause the debugger to single step. This will significantly reduce the execution speed. Therefore, in a debugger system with a limited amount of hardware breakpoints, you can use the Breakpoint Usage window for:
Identifying all breakpoint consumers
Checking that the number of active breakpoints is supported by the target system
Configuring the debugger to use the available breakpoints in a better way, if possible.
For more information, see Breakpoints in the C-SPY hardware debugger drivers.