Analyzing the profiling data
Here follow some examples of how to analyze the data.
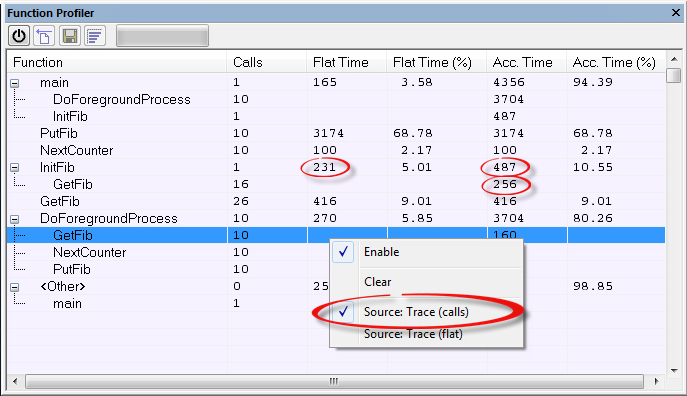
The first figure shows the result of profiling using Source: Trace (calls). The profiler follows the program flow and detects function entries and exits.
For the InitFib function, Flat Time 231 is the time spent inside the function itself.
For the InitFib function, Acc Time 487 is the time spent inside the function itself, including all functions InitFib calls.
For the InitFib/GetFib function, Acc Time 256 is the time spent inside GetFib (but only when called from InitFib), including any functions GetFib calls.
Further down in the data, you can find the GetFib function separately and see all of its subfunctions (in this case none).
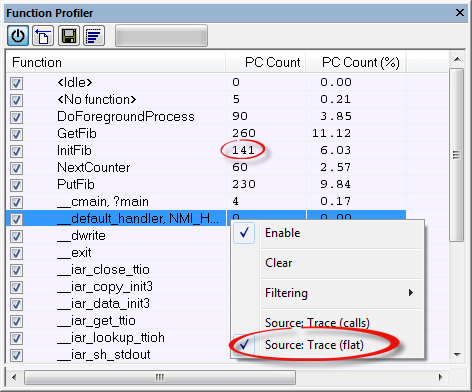
The second figure shows the result of profiling using Source: Trace (flat). In this case, the profiler does not follow the program flow, instead the profiler only detects whether the PC address is within the function scope. For incomplete trace data, the data might contain minor errors.
For the InitFib function, Flat Time 231 is the time (number of hits) spent inside the function itself.
To secure valid data when using a debug probe, make sure to use the maximum trace buffer size and set a breakpoint in your code to stop the execution before the buffer is full.
Note
The <No function> entry represents PC values that are not within the known C-SPY ranges for the application.