Analyzing performance using the graph data
The Timeline window provides a set of tools for analyzing the graph data.
In the Timeline window, right-click and choose Time Axis Unit from the context menu. Select which unit to be used on the time axis—choose between Seconds and Cycles. If Cycles is not available, the graphs are based on different clock sources.
Execute your application to display a graph, following the steps described in Displaying a graph in the Timeline window.
Whenever execution stops, point at the graph with the mouse pointer to get detailed tooltip information for that location.
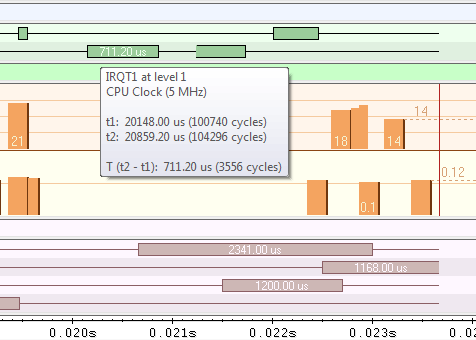
Note that if you have enabled several graphs, you can move the mouse pointer over the different graphs to get graph-specific information.
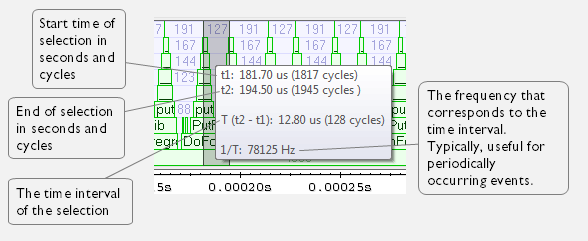
Click in the graph and drag to select a time interval. Point in the graph with the mouse pointer to get timing information for the selection.