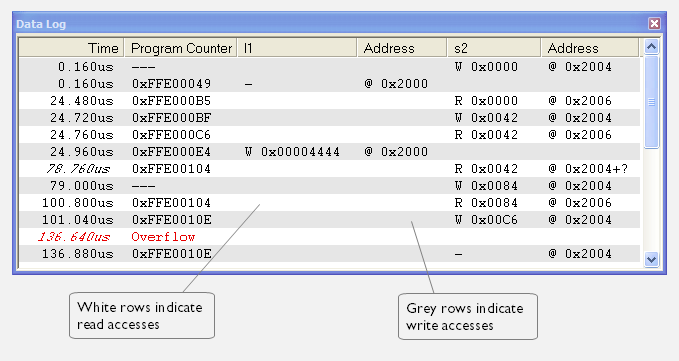
Data Log window
What do you want to do?
Learn about:
Learn how to:
Get reference information about the Data Log window, see below the line.

The Data Log window is available from the C-SPY driver menu.

Use this window to log accesses to up to four different memory locations or areas.
Note
There is a limit on the number of saved logs. When this limit is exceeded, the oldest entries in the buffer are erased.
Requirements
The C-SPY simulator.
Display area
Each row in the display area shows the time, the program counter, and, for every tracked data object, its value and address. All information is cleared on reset. The information is displayed in these columns:
- Time
The time for the data access is based on the clock frequency.
If the time is displayed in italics, the target system has not been able to collect a correct time, but instead had to approximate it.
This column is available when you have selected Show time from the context menu.
- Cycles
The number of cycles from the start of the execution until the event.
If a cycle is displayed in italics, the target system has not been able to collect a correct time, but instead had to approximate it.
This column is available when you have selected Show cycles from the context menu.
- Program Counter*
Displays one of these:
An address, which is the content of the
PC, that is, the address of the instruction that performed the memory access.‑‑-, the target system failed to provide the debugger with any information.
Overflow in red, the communication channel failed to transmit all data from the target system.
- Value
Displays the access type and the value (using the access size) for the location or area you want to log accesses to. For example, if zero is read using a byte access it will be displayed as
0x00, and for a long access it will be displayed as0x00000000.To specify what data you want to log accesses to, use the Data Log breakpoint dialog box. See Data Log breakpoints.
- Address
The actual memory address that is accessed. For example, if only a byte of a word is accessed, only the address of the byte is displayed. The address is calculated as base address + offset, where the base address is retrieved from the Data Log breakpoint dialog box and the offset is retrieved from the logs. If the log from the target system does not provide the debugger with an offset, the offset contains
+ ?.
* You can double-click a line in the display area. If the value of the PC for that line is available in the source code, the editor window displays the corresponding source code (this does not include library source code).
Context menu
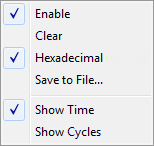
This context menu is available:

These commands are available:
- Enable
Enables the logging system. The system will log information also when the window is closed.
- Clear
Deletes the log information. Note that this will also happen when you reset the debugger.
- Hexadecimal
Toggles between displaying the selected value in decimal or hexadecimal format. Note that this setting also affects the log window.
- Save to File
Displays a standard file selection dialog box where you can select the destination file for the log information. The entries in the log file are separated by
TABandLFcharacters. An X in the Approx column indicates that the timestamp is an approximation.
- Show Time
Displays the Time column. If the Time column is displayed by default in the C-SPY driver you are using, this menu command is not available.
- Show Cycles
Displays the Cycles column. If the Cycles column is not supported in the C-SPY driver you are using, this menu command is not available.