Function Trace window
In this section:
What do you want to do?
Learn about:
Learn how to:
Get reference information about the Function Trace window, see below the line.

The Function Trace window is available from the C-SPY driver menu during a debug session.
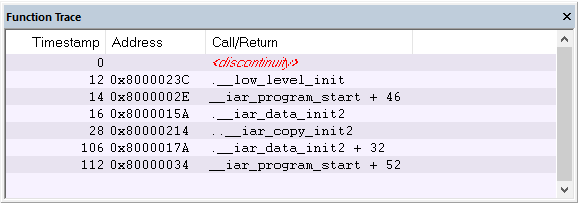
This window displays a subset of the trace data displayed in the Trace window. Instead of displaying all rows, the Function Trace window shows:
The functions called or returned to, instead of the traced instruction
The corresponding trace data.