Timeline window—Call Stack graph
What do you want to do?
Learn about:
Learn how to:
Get related information:
Get reference information about the Timeline window for the call stack, see below the line.

The Timeline window is available from the Driver menu during a debug session.
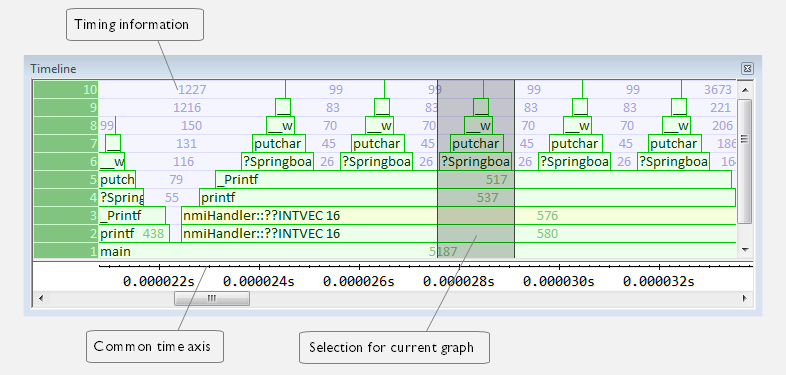
This window displays trace data represented as different graphs, in relation to a shared time axis.
The Call Stack graph displays the sequence of function calls and returns collected by the trace system.
Note
There is a limit on the number of saved logs. When this limit is exceeded, the oldest entries in the buffer are erased.
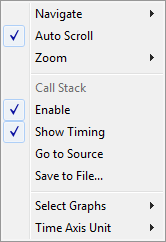
Context menu
This context menu is available:
Note
The contents of this menu are dynamic and depend on which features that your combination of software and hardware supports. However, the list of menu commands below is complete and covers all possible commands.
These commands are available:
- Navigate
Commands for navigating the graph(s). Choose between:
Next moves the selection to the next relevant point in the graph. Shortcut key: right arrow.
Previous moves the selection backward to the previous relevant point in the graph. Shortcut key: left arrow.
First moves the selection to the first data entry in the graph. Shortcut key: Home.
Last moves the selection to the last data entry in the graph. Shortcut key: End.
End moves the selection to the last data in any displayed graph, in other words the end of the time axis. Shortcut key: Ctrl+End.
- Zoom
Commands for zooming the window, in other words, changing the time scale. Choose between:
Zoom to Selection makes the current selection fit the window. Shortcut key: Return.
Zoom In zooms in on the time scale. Shortcut key: +
Zoom Out zooms out on the time scale. Shortcut key: –
10ns, 100ns, 1us, etc makes an interval of 10 nanoseconds, 100 nanoseconds, 1 microsecond, respectively, fit the window.
1ms, 10ms, etc makes an interval of 1 millisecond or 10 milliseconds, respectively, fit the window.
10m, 1h, etc makes an interval of 10 minutes or 1 hour, respectively, fit the window.
- Enable
Toggles the display of the graph on or off. If you disable a graph, that graph will be indicated as OFF in the window. If no data has been collected for a graph, no data will appear instead of the graph.