Power Log Setup window
The Power Log Setupwindow is available from the C-SPY driver menu during a debug session.
Use this window to configure the power measurement. The contents of the window depends on the debug probe and C-SPY driver you are using.
Note
To enable power logging using a J-Link debug probe, choose Enable from the context menu in the Power Logwindow or from the context menu in the power graph in the Timelinewindow.
See also Debugging in the power domain.
Display area for the J-Link debug probe
This is what the window looks like for the J-Link/J-Link Ultra debug probe:
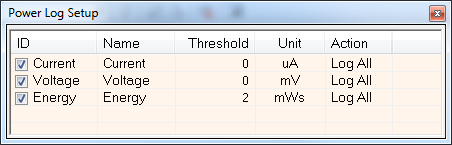
This area contains these columns:
- ID
A unique string that identifies the measurement channel in the probe. Select the check box to activate the channel. If the check box is deselected, logs will not be generated for that channel.
- Name
Specify a user-defined name.
- Threshold
Specify a threshold value in the selected unit. The action you specify will be executed when the threshold value is reached.
- Unit
Displays the selected unit for power. You can choose a unit from the context menu.
- Action
Displays the selected action for the measurement channel. Choose between:
Log All
Log Above Threshold
Log Below Threshold
Log All and Halt CPU Above Threshold
Log All and Halt CPU Below Threshold
Display area for the E2 emulator
This is what the window looks like for the E2 emulator:
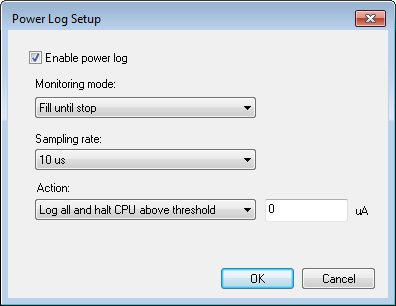
- Enable power log
Enables/disables power logging for the C-SPY E2 emulator driver.
- Monitoring mode
Controls the collection of power data. Chose between:
Fill until stop—collects data as long as the application is executing. If the buffer fills up, the oldest data is cleared as new data is written.
Fill until full—collects data until the buffer is full, but continues executing the application.
Stop program when full—stops executing the application when the buffer is full.
- Sampling rate
Sets the sampling rate in microseconds.
- Action
Controls how power data is logged. Choose between:
Log all—logs all collected data.
Log all and halt CPU above threshold—logs all data and stops executing the application when the measured current exceeds the specified value.
Log all and halt CPU below threshold—logs all data and stops executing the application when the measured current falls below the specified value.
Context menu (J-Link only)
This context menu is available for the J-Link/J-Link Ultra debug probe:
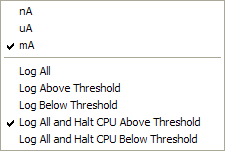
These commands are available:
- nA, uA, mA
Selects the unit for the power display. These alternatives are available for channels that measure current.
- Log All
Logs all values.
- Log Above Threshold
Logs all values above the threshold.
- Log Below Threshold
Logs all values below the threshold.
- Log All and Halt CPU Above Threshold
Logs all values. If a logged value exceeds the threshold, execution is stopped. This might take a few execution cycles.
- Log All and Halt CPU Below Threshold
Logs all values. If a logged value goes below the threshold, execution is stopped. This might take a few execution cycles.