The I-jet Trace CM and I-jet Trace A/R/M in-circuit debugging probes
I-jet Trace CM and I-jet Trace A/R/M are in-circuit debugging probes, designed to take full advantage of the speed and current delivery of the USB3 communication ports. USB 2.0 is also supported, but not recommended due to slower speed and smaller power delivery.
I-jet Trace CM and I-jet Trace A/R/M have all the features of I-jet, but with enhanced performance and support for Arm ETM (Embedded Trace Macrocell) trace and RISC-V N-Trace (Nexus-based Trace). This allows for real-time tracing of instructions and data over a 1, 2 or 4-bit trace bus on Arm Cortex devices. On RISC-V devices, only serial trace and 4-bit trace is supported.
Note
Legacy ARM7/9/11 ETM trace is not supported by I-jet-Trace probes.
I-jet Trace A/R/M provides extensive debug and trace functionality for Arm and RISC-V. I-jet Trace A/R/M is equipped with up to 16-bit wide trace data collection (Arm devices only). Note that Arm Cortex devices must be equipped with the CoreSightTM debug interface.
Note
Whenever I-jet Trace is mentioned in this document, both the I-jet Trace CM and the I-Jet Trace A/R/M probes are referred to, unless otherwise explicitly specified.
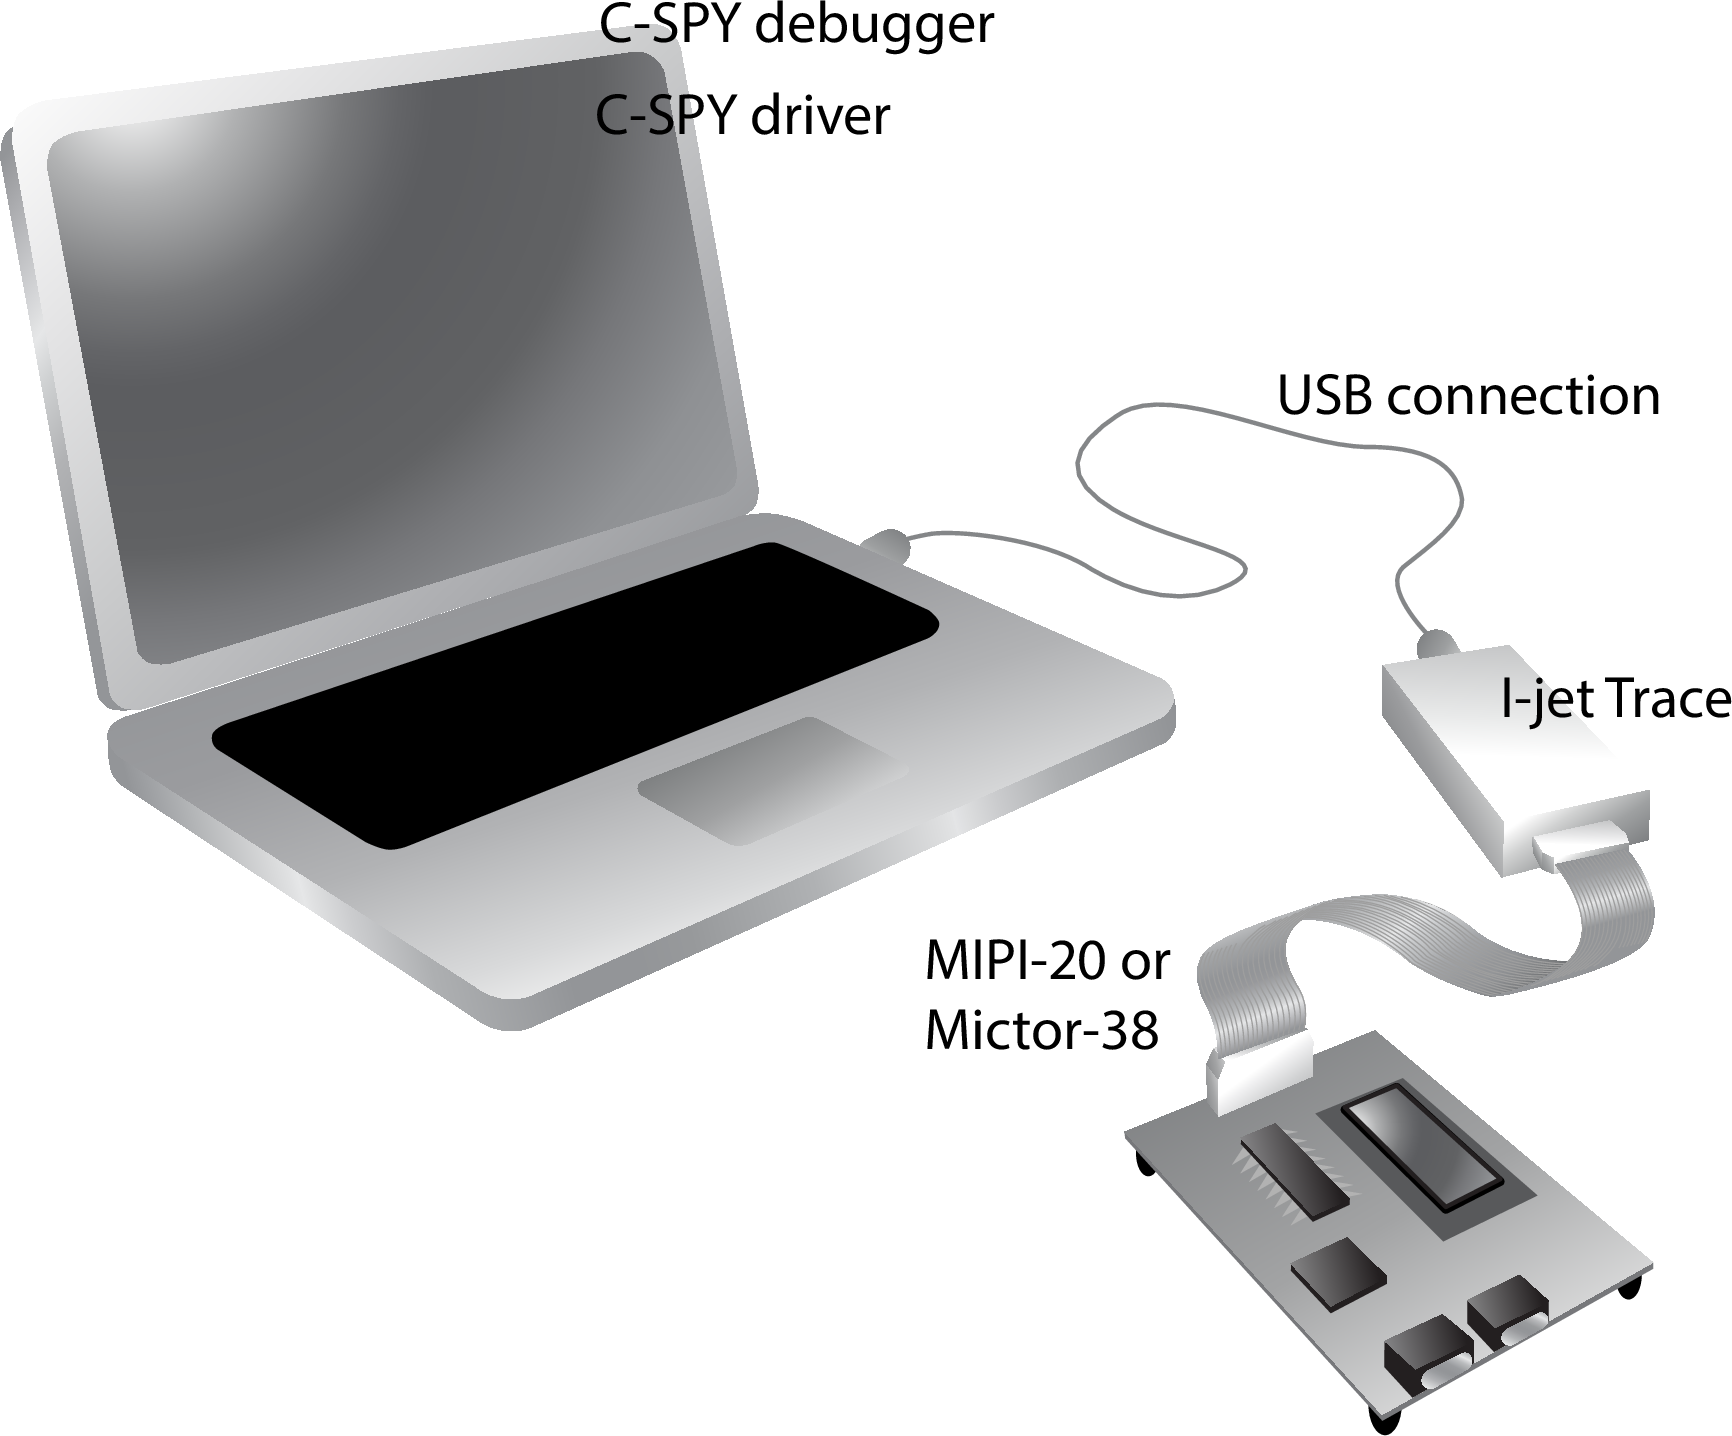
I-jet Trace CM connects to the target board via a MIPI-20 header. By default, I-jet Trace A/R/M connects to the target via the Mictor-38 headers, but it also supports the MIPI-20 headers. The probes connect to the host computer via the USB port.
I-jet Trace streams the program counter, variables, and power measurement data to the host computer to provide a view into program execution in real time. Besides the typical JTAG debugging, I-jet Trace is capable of providing power to the target board, and measuring it with sufficient accuracy to provide a power profile during program execution in real time. This feature is referred to as power debugging.
For debugging Arm Cortex devices, I-jet Trace also supports the SWO (Serial Wire Output) feature, which can be used for tracing the program execution and tracking variables at predefined points in your code.
The I-jet Trace in-circuit debugging probe is also referred to as a debug probe, debug adapter, or JTAG in-circuit emulator by different tool vendors.
Requirements
I-jet Trace needs to be controlled by the IAR C-SPY® Debugger which comes with IAR Embedded Workbench®.
Target connections
These interfaces are supported:
MIPI-20, for up to 4-bit wide trace (part number SHF-110-01-L-D): JTAG, SWD, cJTAG, SWO, ETM, and N-Trace
MIPI-10 for debugging without trace (part number SHF-105-01-L-D): JTAG, SWD, cJTAG, SWO
ARM-20 for debugging without trace (part number HTST-110-01-L-DV): JTAG, SWD, cJTAG, SWO
Mictor-38 for up to 16-bit wide trace (I-jet Trace A/R/M only): JTAG, SWD, cJTAG, ETM, SWO, and N-Trace
MIPI-60 (with trace) and TI-14/cTI-20 (without trace) connections via adapters
Digilent Pmod™ for debugging with or without trace, via adapters
I-jet Trace CM comes with a MIPI-20 connector on the front panel, and with MIPI-20 and MIPI-10 cables.
I-jet Trace A/R/M comes with an adapter board with a Mictor-38 connector that plugs directly into the target board. For boards that do not use the high-speed Mictor connector, the probe also supports the standard MIPI-20 headers.
Note
Only the MIPI-20 and Mictor-38 cables support trace functionality. All other connections (MIPI-10 and ARM-20) are only for plain JTAG/SWD/SWO/cJTAG debugging.
All available I-jet adapters are also compatible with I-jet Trace.