Reference information on code coverage
See also Single stepping.
Code Coverage window
What do you want to do?
Learn about:
Get reference information about the Code Coverage window, see below the line.

The Code Coverage window is available from the View menu.
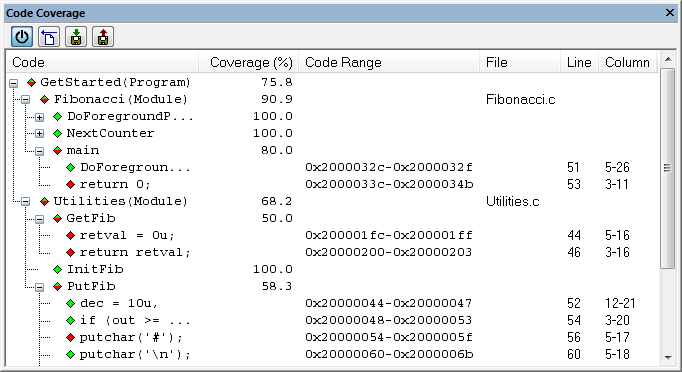
This window reports the status of the current code coverage analysis. For every program, module, and function, the analysis shows the percentage of code that has been executed since code coverage was turned on up to the point where the application has stopped. In addition, all statements that have not been executed are listed. The analysis will continue until turned off.
Only source code that was compiled with debug information is displayed. Therefore, startup code, exit code, and library code are not displayed in the window. Furthermore, coverage information for statements in inlined functions is not displayed. Only the statement containing the inlined function call is marked as executed.
A statement is considered to be executed when all its instructions have been executed. By default, when a statement has been executed, it is removed from the window and the percentage is increased correspondingly.
Toolbar
The toolbar contains buttons for switching code coverage on and off, clearing the code coverage information, and saving/restoring the code coverage session. See the description of the context menu for more detailed information.
The toolbar contains these buttons:
- Activate

Switches code coverage on and off during execution.
- Clear

Clears the code coverage information. All step points are marked as not executed.
- Save session

Saves your code coverage session data to a
*.datfile. This is useful if you for some reason must abort your debug session, but want to continue the session later on. This command might not be supported by the C-SPY driver you are using.
- Restore session

Restores previously saved code coverage session data. This is useful if you for some reason must abort your debug session, but want to continue the session later on. This command might not be supported by the C-SPY driver you are using.
Context menu
This context menu is available:
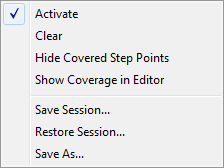
These commands are available:
- Activate
Switches code coverage on and off during execution.
- Clear
Clears the code coverage information. All step points are marked as not executed.
- Hide Covered Step Points
Toggles the display of covered step points on and off. When this option is selected, executed statements are removed from the window.
- Show Coverage in Editor
Toggles the red, green, and yellow highlight colors that indicate code coverage in the source editor window on and off.
- Save Session
Saves your code coverage session data to a
*.datfile. This is useful if you for some reason must abort your debug session, but want to continue the session later on. This command is available on the toolbar. This command is only supported by the C-SPY simulator.
- Restore Session
Restores previously saved code coverage session data. This is useful if you for some reason must abort your debug session, but want to continue the session later on. This command is available on the toolbar. This command is only supported by the C-SPY simulator.
- Save As
Saves the current code coverage result in a text file.