An overview of the debugger startup
In this section:
To make it easier to understand and follow the startup flow, the following figures show the flow of actions performed by C-SPY, and by the target hardware, as well as the execution of any predefined C-SPY setup macros. There is one figure for debugging code located in flash and one for debugging code located in RAM.
For more information about C-SPY system macros, see C-SPY macros.
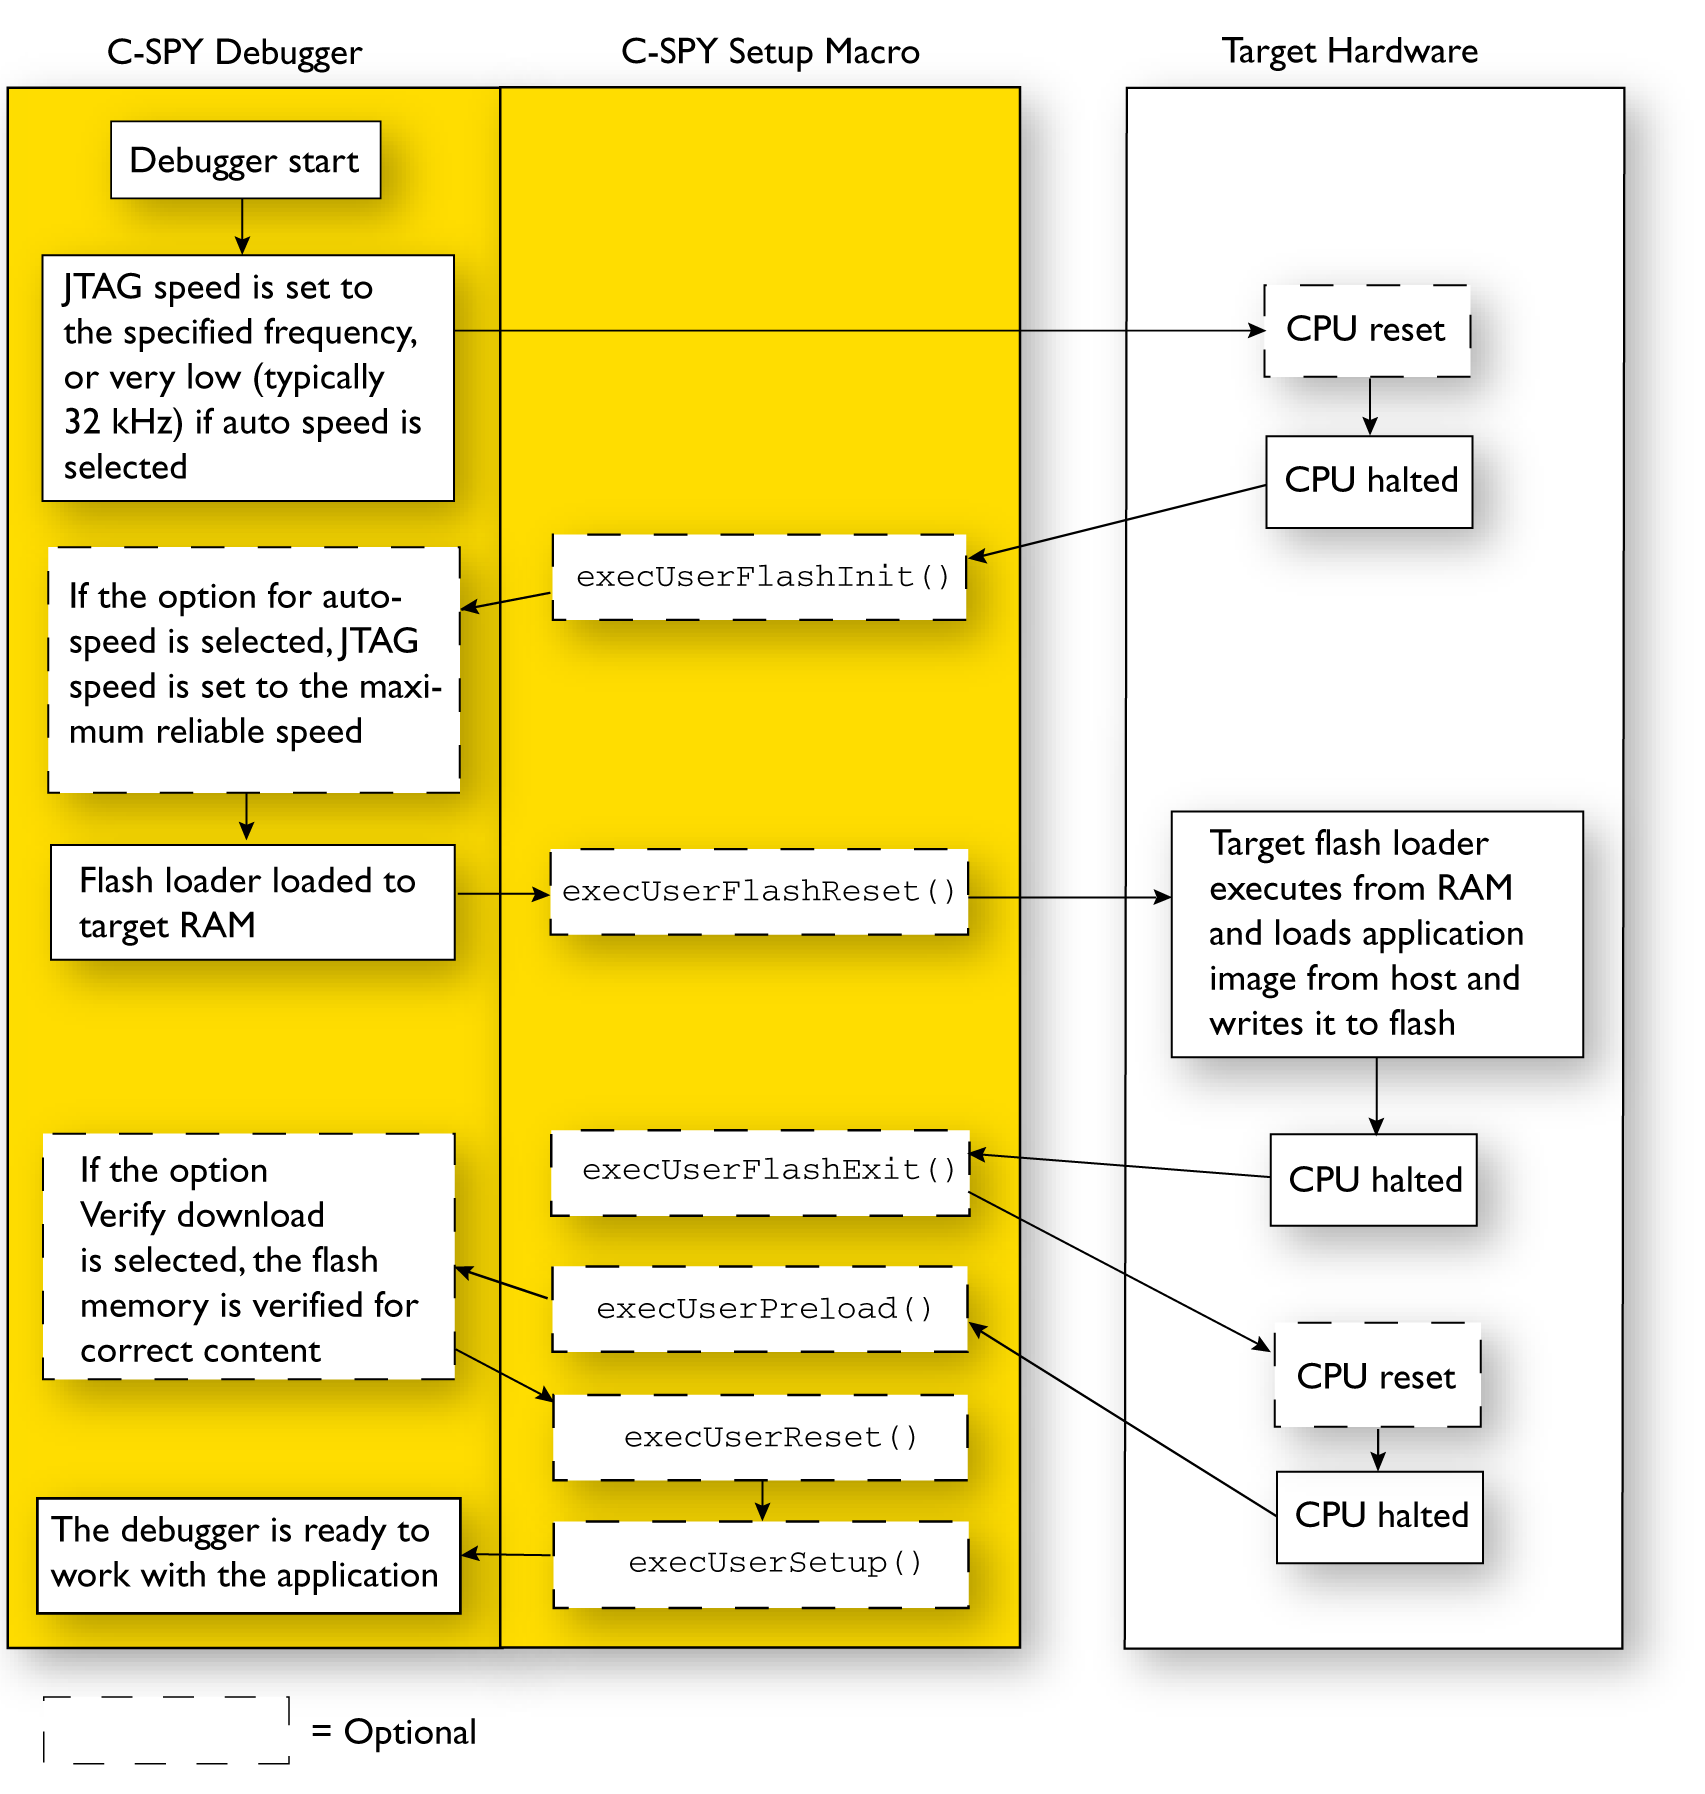
Debugging code in flash
This figure illustrates the debugger startup when debugging code in flash memory:
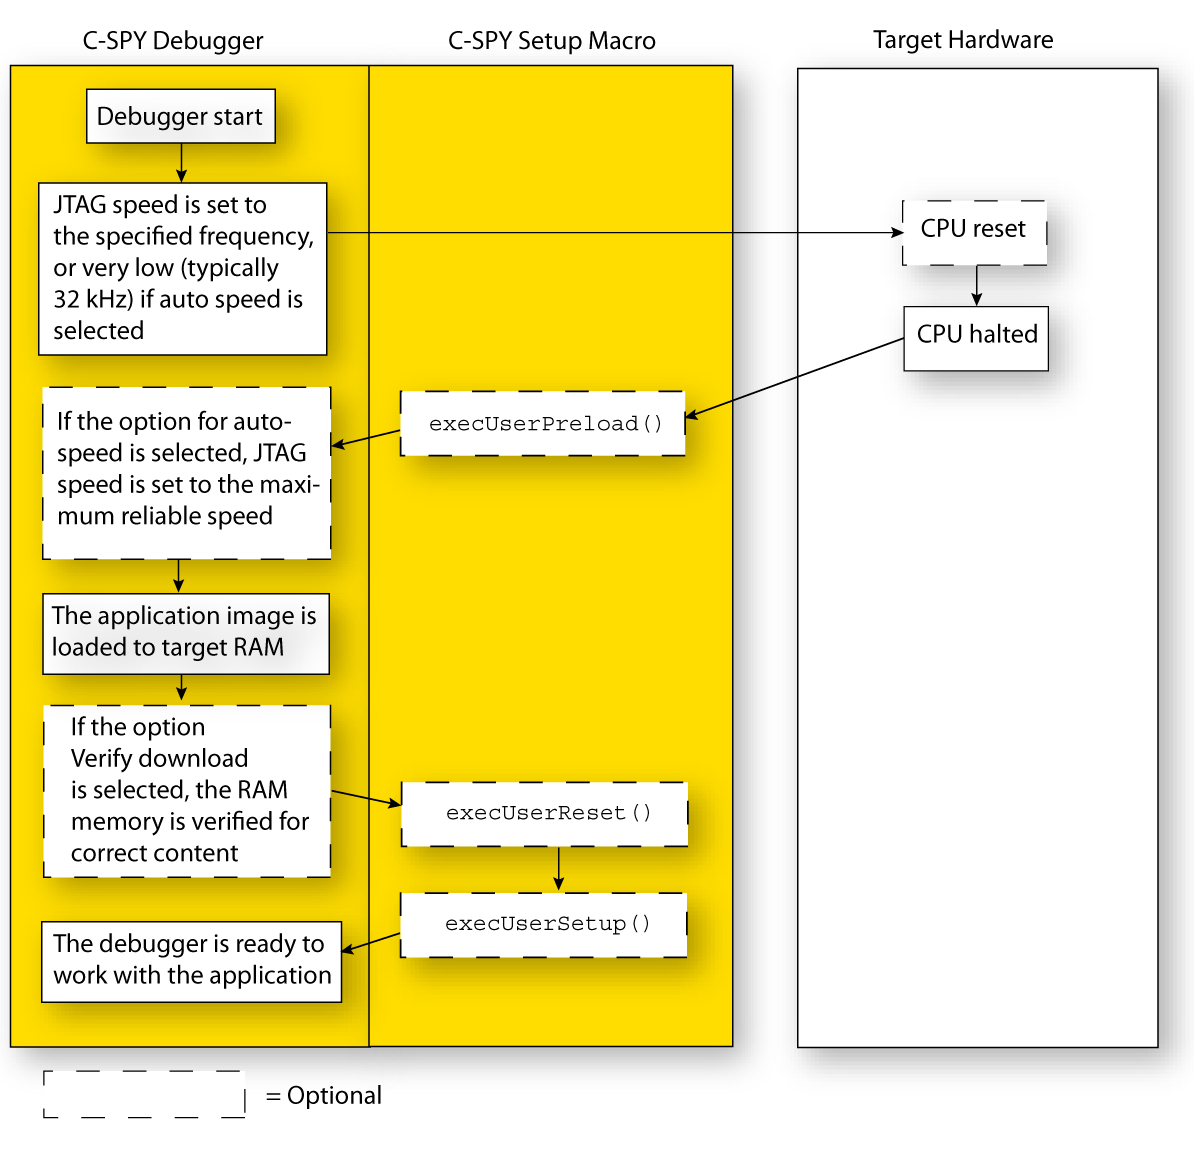
Debugging code in RAM
This figure illustrates the debugger startup when debugging code in RAM: