Performance Monitoring window
What do you want to do?
Learn about:
Get reference information about the Performance Monitoring window, see below the line.

The Performance Monitoring window is available from the C-SPY driver menu during a debug session.
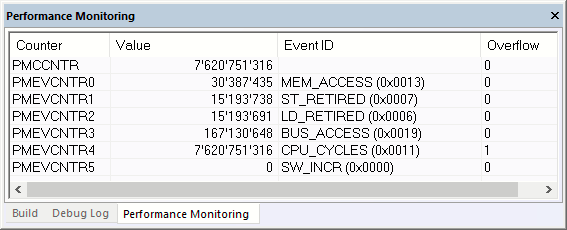
Use this window to monitor counting events or CPU clock cycles through the PMU.
Note
The names of the counters in this window can be used as pseudo-variables in other windows, such as a Watch-type window.
Context menu
This context menu is available for setting up and managing events and counter results:
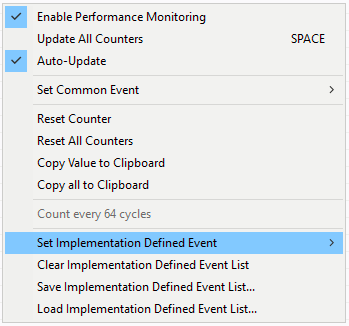
- Enable Performing Monitoring
Enables performance monitoring.
- Update All Counters
If the PMU can be accessed at runtime (that is, when the PMU registers are memory-mapped and are accessible at runtime), this menu command refreshes the values of all counters, including
PMCCNTR, otherwise it will be unavailable.
- Auto-Update
This option is only available when the PMU registers can be accessed at runtime. If enabled, the Performance Monitoring window automatically refreshes at regular intervals. The time between each refresh is controlled by the LiveWatch setting on the Tools>Options>Debugger page.
During execution, C-SPY also accumulates overflows and adds them to the total value of each respective counter.
Note that if the Auto-Update refresh rate is set too low, a PMU register might overflow more than once during execution, which will make the total counts unreliable. Make sure that the updates are made at least once for the smallest register, assuming that it increments with the same frequency as the cycle counter.
- Set Common Event
Opens the list of common events. The selected event will be assigned to the currently selected counter.
Note that this menu item does not work for
PMCCNTR.
- Reset Counter
Resets the currently selected counter. This operation also resets the Overflow for that counter in the
PMOVSRregister.
- Reset All Counters
Resets all counters, including
PMCCNTR. This operation also resets all Overflow bits in thePMOVSRregister.
- Copy Value to Clipboard
Copies the value of the currently selected counter excluding the overflow asterisk (*) marker.
- Copy all to Clipboard
Copies the entire contents of the window. The operation creates a table where each column is separated by a Tab character, and each line contains a counter.
- Count every 64 cycles
When selected, sets the
PMCR.Dbit, which makes thePMCCNTRonly count every 64th clock cycle. This is useful to make the counting last longer before the overflow bit is set. C-SPY automatically multiplies the number of counts by 64. Note that this decreases the accuracy of the cycle counting.
- Set Implementation Defined Event
Opens a menu with implementation-defined events. The selected event will be assigned to the currently selected counter.
Note that this menu item does not work for
PMCCNTR.
- Clear Implementation Defined Event List
Clears the list of implementation-defined events.
- Save Implementation Defined Event List
Opens a standard File Save dialog box from which you can choose a filename to save the current implementation-defined event list. The saved file is a text file where each line contains the ID, name, and description of an event, separated by spaces or tabs. The ID is stored as a hexadecimal number beginning with
0x.
- Load Implementation Defined Event List
Opens a standard File Open dialog box from which you can load a list of implementation-defined events, where each line should contain the ID, name, and description of an event, separated by spaces or tabs.
The format is defined as this:
The first element must be a decimal or hexadecimal number (where hexadecimal numbers must start with
0x)The second element must be a name containing letters, numbers, or underscores
The last element can contain any text, but C-SPY will trim off the starting and ending spaces when the file is loaded
If a line does not follow this syntax, it will be silently ignored.
For example, the first line in a file containing the Armv8 implementation-defined event list should look like this:
0x0040 L1D_CACHE_RD Attribute Level 1 data cache access, read
Note that there are no restrictions to the type of spacing used between the elements in a line. However, a Tab character is usually preferred for editing purposes.