State Log Summary window
What do you want to do?
Learn about:
Learn how to:
Get related information:
Get reference information about the State Log Summary window, see below the line.

The State Log Summary window is available from the C-SPY driver menu.

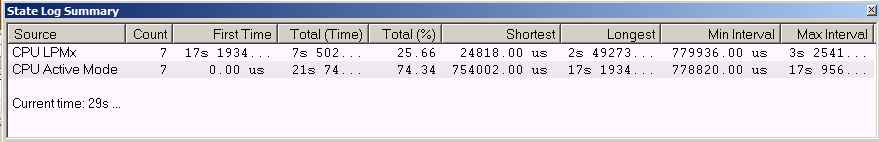
This window displays a summary of logged activity—state changes—for peripheral units and clocks, as well as for CPU modes.
Click a column to sort it according to the values. Click again to reverse the sort order.
At the bottom of the display area, the current time or cycles is displayed—the number of cycles or the execution time since the start of execution.
Requirements
One of these alternatives:
The C-SPY MSP-FET driver and a TI MSP-FET debug probe with EnergyTrace+(TM) Technology provided by Texas Instruments.
The C-SPY TI XDS driver and a TI XDS110 debug probe with EnergyTrace+(TM) Technology provided by Texas Instruments, and one of the MSP432, CC13xx, or CC26xx devices.
Display area
Each row in this area displays statistics about the specific measurement source based on the log information in these columns; and summary information is listed at the bottom of the display area:
- Source
The name of the peripheral unit, clock, or CPU mode.
- Count
The number of times the source was activated.
- First time
The first time the source was activated.
- Total (Time)**
The accumulated time the source has been active.
- Total (%)
The accumulated time in percent that the source has been active.
- Shortest
The shortest time spent with this source active.
- Longest
The longest time spent with this source active.
- Min interval
The shortest time between two activations of this source.
- Max interval
The longest time between two activations of this source.
- Approximative time count
The information displayed depends on the C-SPY driver you are using.
For some C-SPY drivers, this information is not displayed or the value is always zero. In this case, all logs have an exact time stamp.
For other C-SPY drivers, a non-zero value is displayed. The value represents the amount of logs with an approximative time stamp. This might happen if the bandwidth in the communication channel is too low compared to the amount of data packets generated by the CPU or if the CPU generated packets with an approximative time stamp.
- Overflow count
The information displayed depends on the C-SPY driver you are using.
For some C-SPY drivers, this information is not displayed or the value is always zero.
For other C-SPY drivers, the number represents the amount of overflows in the communication channel which can cause logs to be lost. If this happens, it indicates that logs might be incomplete. To solve this, make sure not to use all C-SPY log features simultaneously or check used bandwidth for the communication channel.
- Current time/Current cycles
The information displayed depends on the C-SPY driver you are using.
For some C-SPY drivers, the value is always zero or not visible at all.
For other C-SPY drivers, the number represents the current time or cycles—the number of cycles or the execution time since the start of execution.
** Calculated in the same way as for the Execution time/cycles in the State Log window.
Context menu
This context menu is available:

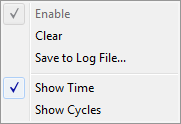
These commands are available:
- Enable
Enables the logging system. The system will log information also when the window is closed.
- Clear
Deletes the log information. Note that this will also happen when you reset the debugger.
- Save to Log File
Displays a standard file selection dialog box where you can select the destination file for the log information. The entries in the log file are separated by
TABandLFcharacters. An X in the Approx column indicates that the timestamp is an approximation.
- Show Time
Displays the Time column. If the Time column is displayed by default in the C-SPY driver you are using, this menu command is not available.
- Show Cycles
Displays the Cycles column. If the Cycles column is not supported in the C-SPY driver you are using, this menu command is not available.