Timeline window—State Log graph
What do you want to do?
Learn about:
Learn how to:
Get related information:
Get reference information about the State Log graph in the Timeline window, see below the line.

The State Log graph in the Timeline window is available from the C-SPY driver menu during a debug session.
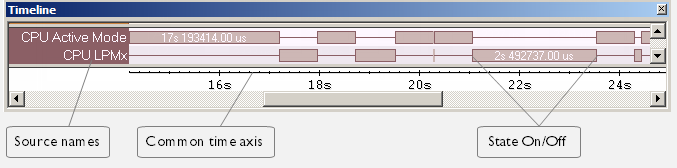
The State Log graph displays a graphical view of logged activity—state changes—for peripheral units and clocks, as well as CPU modes in relation to a common time axis.
Display area
Where:
The label area at the left end of the graph displays the name of the sources of the status information.
The graph itself shows the state of the peripheral units, clocks, and CPU modes generated by the debug probe or associated hardware. The white figure indicates the time spent in the state. This graph is a graphical representation of the information in the State Log window, see State Log window.
At the bottom of the window, there is a shared time axis that uses seconds as the time unit.
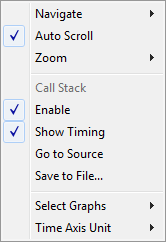
Context menu
This context menu is available:
Note
The context menu contains some commands that are common to all graphs in the Timeline window and some commands that are specific to each graph.
These commands are available:
- Navigate
Commands for navigating the graph(s). Choose between:
Next moves the selection to the next relevant point in the graph. Shortcut key: right arrow.
Previous moves the selection backward to the previous relevant point in the graph. Shortcut key: left arrow.
First moves the selection to the first data entry in the graph. Shortcut key: Home.
Last moves the selection to the last data entry in the graph. Shortcut key: End.
End moves the selection to the last data in any displayed graph, in other words the end of the time axis. Shortcut key: Ctrl+End.
- Auto Scroll
Toggles automatic scrolling on or off. When on, the most recently collected data is automatically displayed when you choose Navigate>End.
- Zoom
Commands for zooming the window, in other words, changing the time scale. Choose between:
Zoom to Selection makes the current selection fit the window. Shortcut key: Return.
Zoom In zooms in on the time scale. Shortcut key: +
Zoom Out zooms out on the time scale. Shortcut key: –
10ns, 100ns, 1us, etc makes an interval of 10 nanoseconds, 100 nanoseconds, 1 microsecond, respectively, fit the window.
1ms, 10ms, etc makes an interval of 1 millisecond or 10 milliseconds, respectively, fit the window.
10m, 1h, etc makes an interval of 10 minutes or 1 hour, respectively, fit the window.
- Power Log
A heading that shows that the Power Log-specific commands below are available.
- Enable
Toggles the display of the graph on or off. If you disable a graph, that graph will be indicated as OFF in the window. If no data has been collected for a graph, no data will appear instead of the graph.
- Viewing Range
Displays a dialog box, see Viewing Range dialog box.
- Size
Determines the vertical size of the graph—choose between Small, Medium, and Large.
- Style
Selects the style of the graph. Choose between:
Bars, displays a vertical bar for each log.
Columns, displays a column for each log.
Levels, displays the graph with a rectangle for each log, optionally color-filled.
Linear, displays the graph as a thin line between consecutive logs.
Note that all styles are not available for all graphs.
- Show Numerical Value
Shows the numerical value of the variable, in addition to the graph.
- Go To Source
Displays the corresponding source code in an editor window, if applicable.
- Open Setup Window
Opens the Power Log Setup window.
- Select Graphs
Selects which graphs to be displayed in the Timeline window.
- Time Axis Unit
Selects the unit used in the time axis—choose between Seconds and Cycles.
If Cycles is not available, the graphs are based on different clock sources. In that case you can view cycle values as tooltip information by pointing at the graph with your mouse pointer.
- Profile Selection
Enables profiling time intervals in the Function Profiler window. Note that this command is only available if the C-SPY driver supports PC Sampling. See Selecting a time interval for profiling information.