IAR Embedded Workbench IDE window
What do you want to do?
Learn about the IDE, see Introduction to the IAR Embedded Workbench IDE
Learn how to: Using and customizing the IDE
Get reference information on the IDE main window, see below the line.

The main window of the IDE is displayed when you launch the IDE.
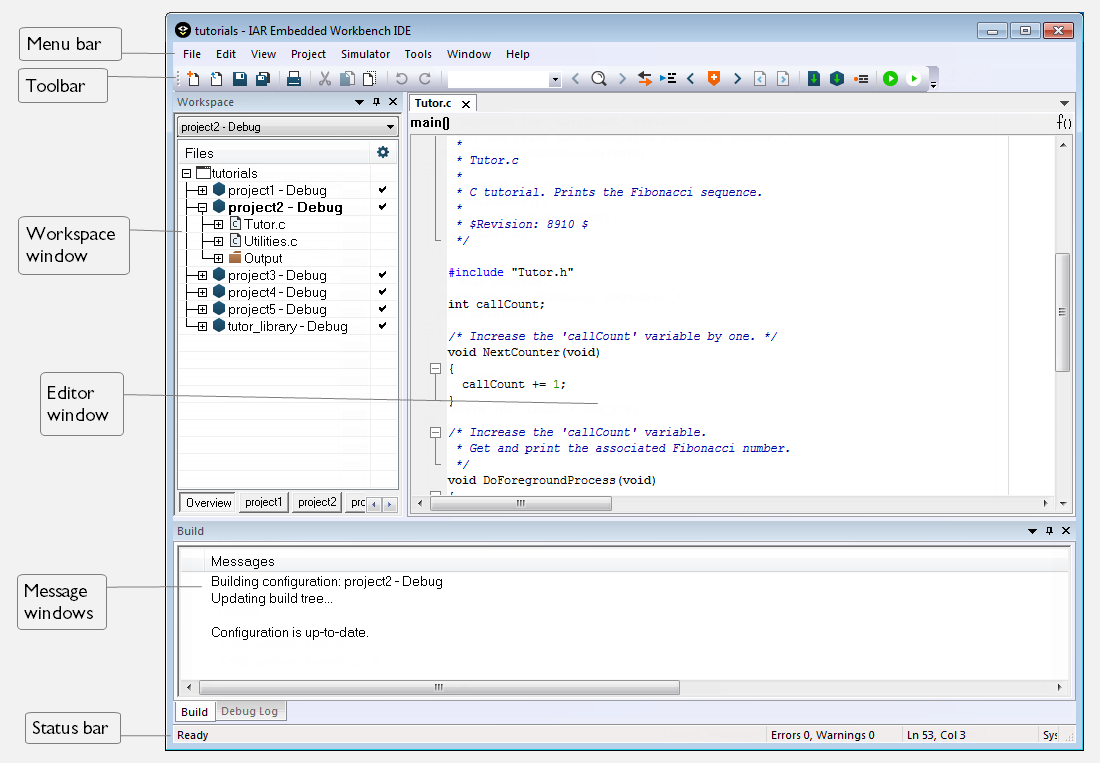
The figure shows the window and its default layout.
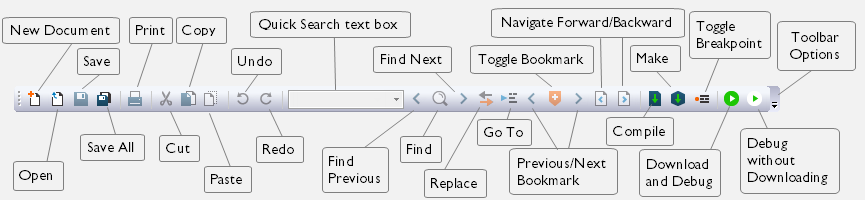
Toolbar
The buttons on the IDE toolbar provide shortcuts for the most useful commands on the IDE menus, and a text box for typing a string to do a quick search. For information about how to add and remove buttons on the toolbars, see Using and customizing the IDE.
For a description of any button, point to it with the mouse pointer. When a command is not available, the corresponding toolbar button is dimmed, and you will not be able to click it.
The toolbars are dockable—drag and drop to rearrange them.
This figure shows the menu commands corresponding to each of the toolbar buttons:
Note
When you start C-SPY, the Download and Debug button will change to a Make and Restart Debugger button  , and the Debug without Downloading will change to a RestartDebugger button
 .
.
- Toolbar Options
Click the Toolbars Options button
 to open the Toolbars Options menu.
Log in
If you have a cloud license for IAR Embedded Workbench for RH850, there is a button in the top right corner of the main IDE window. When you are logged out from your IAR account, the button reads Log in. If you are logged in, it displays your signature.
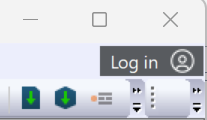
Clicking Log in opens a web page in your default web browser, for logging in to your IAR account. For more information, see the licensing documentation. When you are logged in, clicking the button displays a menu for logging out.
Context menu
This context menu is available by right-clicking a toolbar button when the Customize dialog box is open. For information about how to open this dialog box, see Customize dialog box.
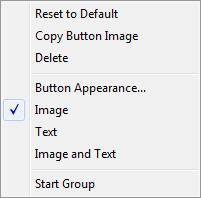
These commands are available:
- Reset to Default
Hides the button icon and displays the name of the button instead.
- Copy Button Image
Copies the button icon and stores the image on the clipboard.
- Delete
Removes the button from the toolbar.
- Button Appearance
Displays the Button Appearance dialog box, see Button Appearance dialog box.
- Image
Displays the button only as an icon.
- Text
Displays the button only as text.
- Image and Text
Displays the button both as an icon and as text.
- Start Group
Inserts a delimiter to the left of the button.
Toolbars Options menu
This menu and its submenus are available by clicking the Toolbars Options button on the far right end of a toolbar:
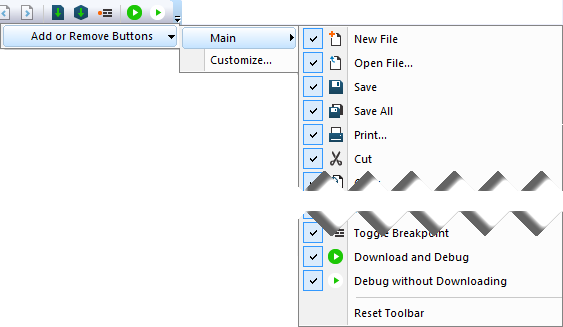
These commands are available:
- Add or Remove Buttons
Opens a submenu.
- toolbar
Opens a submenu that lists all command buttons on the toolbar. Select or deselect a checkbox to show/hide the button on the toolbar. Choose Reset Toolbar to restore the toolbar to its default appearance.
- Customize
Displays the Customize dialog box, see Customize dialog box.
Status bar
The status bar at the bottom of the window can be enabled from the View menu.
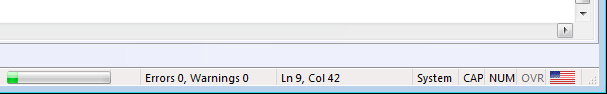
The status bar displays:
Source browser progress information
The number of errors and warnings generated during a build
The position of the insertion point in the editor window. When you edit, the status bar shows the current line and column number containing the insertion point.
The character encoding
The state of the modifier keys Caps Lock, Num Lock, and Overwrite.
If your product package is available in more languages than English, a flag in the corner shows the language version you are using. Click the flag to change the language. The change will take force the next time you launch the IDE.