Introduction to monitoring memory and registers
Briefly about monitoring memory and registers
C-SPY provides many windows for monitoring memory and registers, most of them available from the View menu:
The Memory window
Gives an up-to-date display of a specified area of memory—a memory zone—and allows you to edit it. Data coverage along with execution of your application is highlighted with different colors. You can fill specified areas with specific values and you can set breakpoints directly on a memory location or range. You can open several instances of this window, to monitor different memory areas. The content of the window can be regularly updated while your application is executing.
The Symbolic Memory window
Displays how variables with static storage duration are laid out in memory. This can be useful for better understanding memory usage or for investigating problems caused by variables being overwritten, for example by buffer overruns.
The Stack window
Displays the contents of the stack, including how stack variables are laid out in memory. In addition, integrity checks of the stack can be performed to detect and warn about problems with stack overflow. For example, the Stack window is useful for determining the optimal size of the stack. You can open up to two instances of this window, each showing different stacks or different display modes of the same stack.
The Registers window
Gives an up-to-date display of the contents of the processor registers and SFRs, and allows you to edit them. Because of the large amount of registers—memory-mapped peripheral unit registers and CPU registers—it is inconvenient to show all registers concurrently in the Registers window. Instead you can divide registers into application-specific groups. You can choose to load either predefined register groups or define your own groups. You can open several instances of this window, each showing a different register group.
The SFR Setup window
Displays the currently defined SFRs that C-SPY has information about, both factory-defined (retrieved from the device description file) and custom-defined SFRs. If required, you can use the Edit SFR dialog box to customize the SFR definitions.
To view the memory contents for a specific variable, simply drag the variable to the Memory window or the Symbolic Memory window. The memory area where the variable is located will appear.
Warning
Reading the value of some registers might influence the runtime behavior of your application. For example, reading the value of a UART status register might reset a pending bit, which leads to the lack of an interrupt that would have processed a received byte. To prevent this from happening, make sure that the Registers window containing any such registers is closed when debugging a running application.
C-SPY memory zones
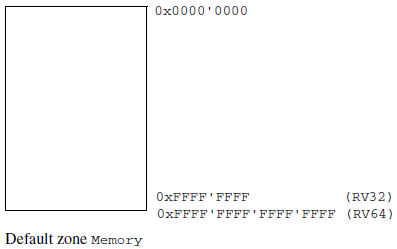
In C-SPY, the term zone is used for a named memory area. A memory address, or location, is a combination of a zone and a numerical offset into that zone. By default, the RISC-V architecture has one memory-mapped zone, Memory, which covers the whole RISC-V memory range.
In addition to this zone, the control and status registers (CSRs) are accessed through the non memory-mapped CSRMemory zone.
Memory zones are used in several contexts, most importantly in the Memory and Disassembly windows, and in C-SPY macros. In the windows, use the Zone box to choose which memory zone to display.
For normal memory, the default zone Memory can be used, but certain I/O registers might require to be accessed as 8, 16, 32, or 64 bits to give correct results. By using different memory zones, you can control the access width used for reading and writing in, for example, the Memory window. When using the zone Memory, the debugger automatically selects the most suitable access width.
Note
For the C-SPY I-jet driver, you can specify the automatic selection of access width in the Edit Memory Range dialog box, see Edit Memory Range dialog box for C-SPY hardware debugger drivers.
Memory configuration for the C-SPY simulator
To simulate the target system properly, the C-SPY simulator needs information about the memory configuration. By default, C-SPY uses a configuration based on information retrieved from the device description file.
The C-SPY simulator provides various mechanisms to improve the configuration further:
If the default memory configuration does not specify the required memory address ranges, you can specify the memory address ranges shall be based on:
The zones predefined in the device description file
The section information available in the debug file
Or, you can define your own memory address ranges, which you typically might want to do if the files do not specify memory ranges for the specific device that you are using, but instead for a family of devices (perhaps with various amounts of on-chip RAM).
For each memory address range, you can specify an access type. If a memory access occurs that does not agree with the specified access type, C-SPY will regard this as an illegal access and warn about it. In addition, an access to memory that is not defined is regarded as an illegal access. The purpose of memory access checking is to help you to identify memory access violations.
For more information, see Memory Configuration dialog box for the C-SPY simulator.
Memory configuration for C-SPY hardware debugger drivers
To handle memory as efficiently as possible during debugging, C-SPY needs information about the memory configuration. By default, C-SPY uses a configuration based on information retrieved from the device description file.
You should make sure the memory address ranges match the memory available on your device. Providing C-SPY with information about the memory layout of the target system is helpful in terms of both performance and functionality:
Reading (and writing) memory (if your debug probe is connected through a USB port) can be fast, but is usually the limiting factor when C-SPY needs to update many debugger windows. C-SPY can cache memory contents to speed up performance, provided it has correct information about the target memory.
You can inform C-SPY that the content of certain memory address ranges will not be changed during a debug session. C-SPY can keep a copy of that memory readable even when the target system does not normally allow reading (such as when it is executing).
Note that if you specify the cache type ROM/Flash, C-SPY treats such memory as constant during the whole debug session (which improves efficiency, when updating some C-SPY windows). If your application modifies flash memory during runtime, do not use the ROM/Flash cache type.
You can prevent C-SPY from accessing memory outside specified memory address ranges, which can be important for certain hardware.
The Memory Configuration dialog box is automatically displayed the first time you start the C-SPY driver for a given project, unless the device description file contains a memory description which is explicitly tagged as correct and complete. Subsequent starts will not display the dialog box unless you have made project changes that might cause the memory configuration to change, for example if you have selected another device description file.
For more information, see Memory Configuration dialog box for C-SPY hardware debugger drivers.