Stack window
What do you want to do?
Learn about:
Learn how to:
Setting tool options for the Stack window, see the IDE documentation
Get reference information about the Stack window, see below the line.

The Stack window is available from the View menu.

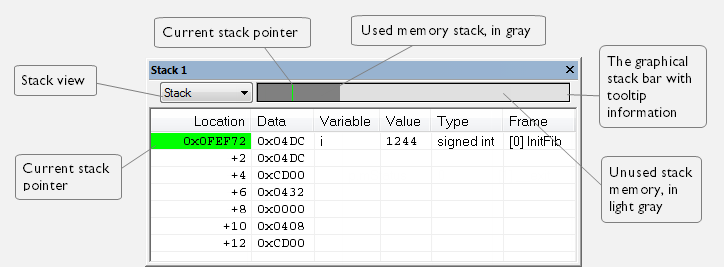
This window is a memory window that displays the contents of the stack. The graphical stack bar shows stack usage.
Note
By default, this window uses one physical breakpoint. For more information, see Breakpoint consumers.
Requirements
Can be used with all C-SPY debugger drivers and debug probes.
Toolbar
The toolbar contains:
- Stack
Selects which stack to view. This applies to cores with multiple stacks.
The graphical stack bar
Displays the state of the stack graphically.
The left end of the stack bar represents the bottom of the stack, in other words, the position of the stack pointer when the stack is empty. The right end represents the end of the memory address range reserved for the stack. The graphical stack bar turns red when the stack usage exceeds a threshold that you can specify.
To enable the stack bar, choose Tools>Options>Stack>Enable graphical stack display and stack usage tracking. This means that the functionality needed to detect and warn about stack overflows is enabled.
Tip
Place the mouse pointer over the stack bar to get tooltip information about stack usage.
Display area
This area contains these columns:
- Location
Displays the location in memory. The addresses are displayed in increasing order. The address referenced by the stack pointer, in other words the top of the stack, is highlighted in a green color.
- Data
Displays the contents of the memory unit at the given location. From the Stack window context menu, you can select how the data should be displayed—as a 1-, 2-, or 4-byte group of data.
- Variable
Displays the name of a variable, if there is a local variable at the given location. Variables are only displayed if they are declared locally in a function, and located on the stack and not in registers.
- Value
Displays the value of the variable.
- Type
Displays the data type of the variable.
- Frame
Displays the name of the function that the call frame corresponds to.
Context menu
This context menu is available:

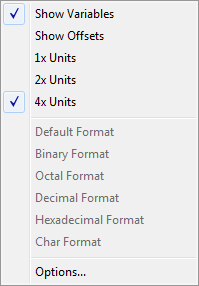
These commands are available:
- 1x Units
Displays the memory contents as single bytes.
- 2x Units
Displays the memory contents as 2-byte groups.
- 4x Units
Displays the memory contents as 4-byte groups.
- Default Format, Binary Format, Octal Format, Decimal Format, Hexadecimal Format, Char Format
Changes the display format of expressions. The display format setting affects different types of expressions in different ways. Your selection of display format is saved between debug sessions. These commands are available if a selected line in the window contains a variable.
The display format setting affects different types of expressions in these ways:
Variables
The display setting affects only the selected variable, not other variables.
Array elements
The display setting affects the complete array, that is, the same display format is used for each array element.
Structure fields
All elements with the same definition—the same field name and C declaration type—are affected by the display setting.
- Options
Opens the IDE Options dialog box where you can set options specific to the Stack window, see Stack options.