Introduction to application execution
C-SPY allows you to monitor and control the execution of your application. By single-stepping through it, and setting breakpoints, you can examine details about the application execution, for example the values of variables and registers. You can also use the call stack to step back and forth in the function call chain.
The terminal I/O and debug log features let you interact with your application.
You can find commands for execution on the Debug menu and on the toolbar.
C-SPY allows you to switch between source mode and disassembly mode debugging as needed.
Source debugging provides the fastest and easiest way of developing your application, without having to worry about how the compiler or assembler has implemented the code. In the editor windows you can execute the application one statement at a time while monitoring the values of variables and data structures.
Disassembly mode debugging lets you focus on the critical sections of your application, and provides you with precise control of the application code. You can open a disassembly window which displays a mnemonic assembler listing of your application based on actual memory contents rather than source code, and lets you execute the application exactly one machine instruction at a time.
Regardless of which mode you are debugging in, you can display registers and memory, and change their contents.
C-SPY allows more stepping precision than most other debuggers because it is not line-oriented but statement-oriented. The compiler generates detailed stepping information in the form of step points at each statement, and at each function call. That is, source code locations where you might consider whether to execute a step into or a step over command. Because the step points are located not only at each statement but also at each function call, the step functionality allows a finer granularity than just stepping on statements.
There are several factors that can slow down the stepping speed. If you find it too slow, see Troubleshooting slow stepping speed for some tips.
The step commands
There are four step commands:
Step Into
Step Over
Next Statement
Step Out
Using the Autostep settings dialog box, you can automate the single stepping. For more information, see Autostep settings dialog box.
If your application contains an exception that is caught outside the code which would normally be executed as part of a step, C-SPY terminates the step at the catch statement.
Consider this example and assume that the previous step has taken you to the f(i) function call (highlighted):
extern int g(int);int f(int n){value =g(n-1)+g(n-2) + g(n-3);return value; }int main(){ ... f(i); value ++; }
Breakpoints when single stepping using the OCD driver
If you are using one of the OCD emulators—E1, E2, E2 Lite/E2 On-Board, E20, EZ-CUBE, TK, COM Port—breakpoints are ignored in code during single stepping, and also when the Run to Cursor command is used. Among other things, this means that terminal I/O does not work when single stepping using an OCD emulator.
Step Into
While stepping, you typically consider whether to step into a function and continue stepping inside the function or subroutine. The Step Into command takes you to the first step point within the subroutine g(n-1):
extern int g(int);
int f(int n)
{
 value = g(n-1) + g(n-2) + g(n-3);
 return value;
}
The Step Into command executes to the next step point in the normal flow of control, regardless of whether it is in the same or another function.
Step Over
The Step Over command executes to the next step point in the same function, without stopping inside called functions. The command would take you to the g(n-2) function call, which is not a statement on its own but part of the same statement as g(n-1). Thus, you can skip uninteresting calls which are parts of statements and instead focus on critical parts:
extern int g(int);
int f(int n)
{
 value = g(n-1) + g(n-2) + g(n-3);
 return value;
}
Next Statement 
The Next Statement command executes directly to the next statement, in this case return value, allowing faster stepping:
extern int g(int);int f(int n){value =g(n-1)+g(n-2) + g(n-3);return value; }
Step Out 
When inside the function, you can—if you wish—use the Step Out command to step out of it before it reaches the exit. This will take you directly to the statement immediately after the function call:
extern int g(int);int f(int n){value =g(n-1)+g(n-2) g(n-3);return value; } int main() { ... f(i); value ++; }
The possibility of stepping into an individual function that is part of a more complex statement is particularly useful when you use C code containing many nested function calls. It is also very useful for C++, which tends to have many implicit function calls, such as constructors, destructors, assignment operators, and other user-defined operators.
This detailed stepping can in some circumstances be either invaluable or unnecessarily slow. For this reason, you can also step only on statements, which means faster stepping.
If you find that stepping speed is slow, these troubleshooting tips might speed up stepping:
If you are using a hardware debugger system, keep track of how many hardware breakpoints that are used and make sure some of them are left for stepping.
Stepping in C-SPY is normally performed using breakpoints. When C-SPY performs a step command, a breakpoint is set on the next statement and the application executes until it reaches this breakpoint. If you are using a hardware debugger system, the number of hardware breakpoints—typically used for setting a stepping breakpoint in code that is located in flash/ROM memory—is limited. If you, for example, step into a C
switchstatement, breakpoints are set on each branch; this might consume several hardware breakpoints. If the number of available hardware breakpoints is exceeded, C-SPY switches into single stepping on assembly level, which can be very slow.For more information, see and Breakpoint consumers.
Disable trace data collection, using the Enable/Disable button in both the Trace and the Function Profiling windows. Trace data collection might slow down stepping because the collected trace data is processed after each step. Note that it is not sufficient to just close the corresponding windows to disable trace data collection.
Choose to view only a limited selection of SFR registers. You can choose between two alternatives. Either type
#SFR_name(whereSFR_namereflects the name of the SFR you want to monitor) in the Watch window, or create your own filter for displaying a limited group of SFRs in the Registers window. Displaying many SFR registers might slow down stepping because all registers must be read from the hardware after each step. See Defining application-specific register groups.Close the Memory and Symbolic Memory windows if they are open, because the visible memory must be read after each step and that might slow down stepping.
Close any window that displays expressions such as Watch, Live Watch, Locals, Statics if it is open, because all these windows read memory after each step and that might slow down stepping.
Close the Stack window if it is open. Choose Tools>Options>Stack and disable the Enable graphical stack display and stack usage tracking option if it is enabled.
If possible, increase the communication speed between C-SPY and the target board/emulator.
Go 
The Go command continues execution from the current position until a breakpoint or program exit is reached.
Run to Cursor 
The Run to Cursor command executes to the position in the source code where you have placed the cursor. The Run to Cursor command also works in the Disassembly window and in the Call Stack window.
At each stop, C-SPY highlights the corresponding C or C++ source or instruction with a green color, in the editor and the Disassembly window respectively. In addition, a green arrow appears in the editor window when you step on C or C++ source level, and in the Disassembly window when you step on disassembly level. This is determined by which of the windows is the active window. If none of the windows are active, it is determined by which of the windows was last active.
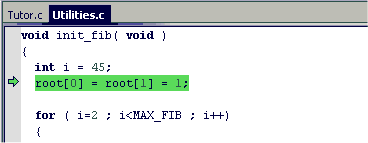
For simple statements without function calls, the whole statement is typically highlighted. When stopping at a statement with function calls, C-SPY highlights the first call because this illustrates more clearly what Step Into and Step Over would mean at that time.
Occasionally, you will notice that a statement in the source window is highlighted using a pale variant of the normal highlight color. This happens when the program counter is at an assembler instruction which is part of a source statement but not exactly at a step point. This is often the case when stepping in the Disassembly window. Only when the program counter is at the first instruction of the source statement, the ordinary highlight color is used.
Code coverage
From the context menu in the Code Coverage window, you can toggle highlight colors and icons in the editor window that show code coverage analysis for the source code, see Code Coverage window.
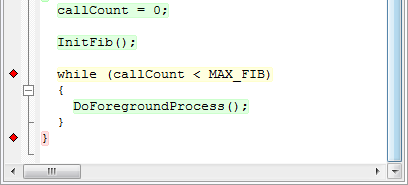
These are the colors and icons that are used:
Red highlight color and a red diamond—the code range has not been executed.
Green highlight color—100% of the code range has been executed.
Yellow highlight color and a red diamond—parts of the code range have been executed.
This figure illustrates all three code coverage highlight colors:
The compiler generates extensive call frame information. This allows C-SPY to show, without any runtime penalty, the complete function call chain at any time.
Tip
Typically, this is useful for two purposes:
The Call Stack window shows a list of function calls, with the current function at the top. When you inspect a function in the call chain, the contents of all affected windows are updated to display the state of that particular call frame. This includes the editor, Locals, Register, Watch, and Disassembly windows. A function would normally not make use of all registers, so these registers might have undefined states and be displayed as dashes (‑‑-).
In the editor and Disassembly windows, a green highlight indicates the topmost, or current, call frame; a yellow highlight is used when inspecting other frames.
For your convenience, it is possible to select a function in the call stack and click the Run to Cursor command to execute to that function.
Assembler source code does not automatically contain any call frame information. To see the call chain also for your assembler modules, you can add the appropriate CFI assembler directives to the assembler source code. For more information, see Tracking call frame usage.
Note
For highly optimized code, C-SPY might not be able to identify all calls. This means that for highly optimized code, the call stack is not entirely trustworthy.
Sometimes you might have to debug constructions in your application that use stdin and stdout without an actual hardware device for input and output. The Terminal I/O window lets you enter input to your application, and display output from it. You can also direct terminal I/O to a file, using the Terminal I/O Log Files dialog box.
Tip
This facility is useful in two different contexts:
If your application uses
stdinandstdoutFor producing debug trace printouts
For more information, see Terminal I/O window and Terminal I/O Log File dialog box.
Note
If you are using one of the OCD emulators, terminal I/O might not work. See Breakpoints when single stepping using the OCD driver.
The Debug Log window displays debugger output, such as diagnostic messages, macro-generated output, and information about trace.
Tip
It can sometimes be convenient to log the information to a file where you can easily inspect it, see Debug Log window. The two main advantages are:
The file can be opened in another tool, for instance an editor, so you can navigate and search within the file for particularly interesting parts.
The file provides history about how you have controlled the execution, for instance, which breakpoints that have been triggered etc.