Trace window
What do you want to do?
Learn about:
Learn how to:
Get reference information about the Trace window, see below the line.

The Trace window is available from the C-SPY driver menu.
This window displays the collected trace data.
Trace toolbar
The toolbar in the Trace window and in the Function Trace windowcontains:
- Enable/Disable

Enables and disables collecting and viewing trace data in this window. This button is not available in the Function Trace window.
- Clear trace data

Clears the trace buffer. Both the Trace window and the Function Trace window are cleared.
- Toggle source

Toggles the Trace column between showing only disassembly or disassembly together with the corresponding source code.
- Browse

Toggles browse mode on or off for a selected item in the Trace window, see Browsing through trace data.
- Find

Displays a dialog box where you can perform a search, see Find in Trace dialog box.
- Save

Displays a standard Save As dialog box where you can save the collected trace data to a text file, with tab-separated columns.
- Settings

Opens the Trace Setup dialog box (only hardware), see Trace Setup dialog box (E1, E2, E2 Lite/E2 On-Board, EZ-CUBE2, COM Port).
- Progress bar

When a large amount of trace data has been collected, there might be a delay before all of it has been processed and can be displayed. The progress bar reflects that processing.
Display area (in the C-SPY simulator)
This area displays a collected sequence of executed machine instructions. In addition, the window can display trace data.
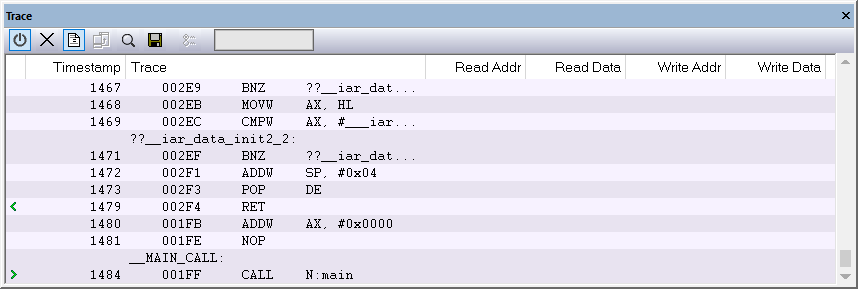
This area contains these columns for the C-SPY simulator:
- #
A serial number for each row in the trace buffer. Simplifies the navigation within the buffer.
- Timestamp
The number of cycles elapsed to this point.
- Trace
The collected sequence of executed machine instructions. Optionally, the corresponding source code can also be displayed.
- Read Addr, Read Data, Write Addr, Write Data
These columns show reads and writes to memory.
A red-colored row indicates that the previous row and the red row are not consecutive. This means that there is a gap in the collected trace data, for example because trace data has been lost due to an overflow.
Display area (for a supported emulator)
This area displays information and trace data about the executed machine instructions:
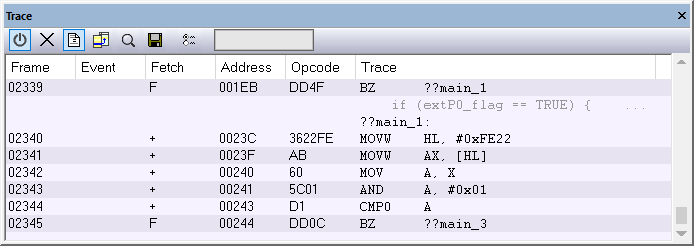
This area contains these columns for the supported C-SPY emulators:
- Frame
The number of the trace buffer frame. By double-clicking the frame number, the collected fetch address will be displayed in the editor window.
- Event
The name of the single events that have been triggered by the event conditions. For information about event conditions, see Edit Events dialog box and Edit Sequencer Events dialog box.
- Fetch
The fetch type of the instruction associated with the trace frame.
For the E1, E2, E2 Lite/E2 On-Board, EZ-CUBE2, and COM Port emulators, this is one of:
F— a verified trace frameS— a verified trace frame based on section trace+— a calculated trace frameFi— an interrupt trace frame+?— a trace frame that might have been skipped (it cannot be determined whether it has been executed)...— a trace restart (to resynchronize the trace and the execution)- Address
The address of the executed instruction.
- Opcode
The operation code of the instruction associated with the trace frame. After the hexadecimal value, extra information can be displayed—x2 if two instructions were executed and C if the instruction was read from the I-Cache.
- Trace
The collected sequence of executed machine instructions. Optionally, the corresponding source code can also be displayed.
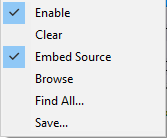
Context menu
This context menu is available:
Note
The contents of this menu are dynamic and depend on which features that your combination of software and hardware supports. However, the list of menu commands below is complete and covers all possible commands.
These commands are available:
- Enable
Enables and disables collecting and viewing trace data in this window.
- Clear
Clears the trace buffer. Both the Trace window and the Function Trace window are cleared.
- Embed source
Toggles the Trace column between showing only disassembly or disassembly together with the corresponding source code.
- Browse
Toggles browse mode on or off for a selected item in the Trace window, see Browsing through trace data.
- Find All
Displays a dialog box where you can perform a search in the Trace window, see Find in Trace dialog box. The search results are displayed in the Find in Trace window—available by choosing the View>Messages command, see Find in Trace window.
- Save
Displays a standard Save As dialog box where you can save the collected trace data to a text file, with tab-separated columns.