Timeline window—Power graph
In this section:
What do you want to do?
Learn about:
Learn how to:
Get related information:
Get reference information about the Power graph in the Timeline window, see below the line.

The power graph in the Timeline window is available from the C-SPY driver menu during a debug session.
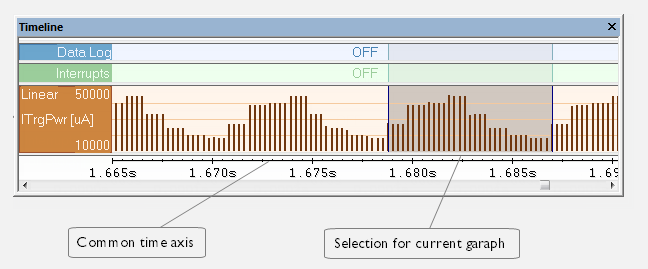
The power graph displays a graphical view of power measurement samples generated by the debug probe or associated hardware in relation to a common time axis.
Note
There is a limit on the number of saved logs. When this limit is exceeded, the oldest entries in the buffer are erased.