- IAR Embedded Workbench for RX 5.20
- C-SPY Debugging
- Trace
- Reference information on trace
- Trace Settings dialog box
Trace Settings dialog box
The Trace Settings dialog box is available from the C-SPY driver menu.
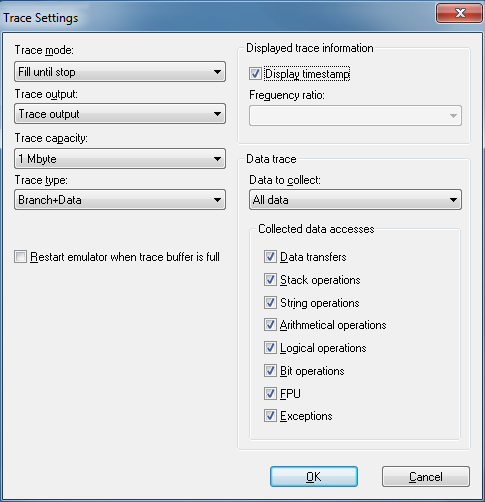
Use this dialog box to configure trace generation and collection.
See also Getting started with trace.
Requirements
A C-SPY hardware debugger driver.
Trace mode
Selects the trace collection mode. Choose between:
- Fill until stop
Continues to collect trace data until the execution stops or a trace stop breakpoint stops the collection.
- Fill until full
Continues to collect trace data until the buffer is full.
Trace output
Controls the generation of trace data. Choose between:
- CPU execution
CPU execution is given priority, meaning that some trace data might be lost.
- Trace output
Generating trace data is given priority. Because the CPU execution is paused when trace data is generated, execution speed slows down.
- Do not output
No trace data is generated. The trace buffer of the MCU will be used.
Note
For the E1, E2, and E2 Lite/EZ-CUBE2 emulators and the J-Link debug probe, only the setting Do not output is available.
Trace capacity
Sets the size of the trace buffer: 1, 2, 4, 8, 16, or 32 Mbytes.
Note
This option is only available for the E20 emulator.
Trace type
Selects the type of trace data that is collected. Choose between:
- Branch
Collects source and destination address information on branches that occurred during program execution.
- Branch+Data
Collects branch and data access information. Only available for the RX600 architecture.
- Data
Collects data information on events that occurred during program execution. For the RX100 and RX200 architectures, only data accesses set up with data trace collection breakpoints can be traced.
Restart emulator when trace buffer is full
Halts execution when the trace buffer is full and restarts the emulator after the buffer has been read by the emulator. This option offers full trace, but might result in very large amounts of trace data.
Note
This option is only available for the E20 emulator using a 38-pin connection, and requires that the option Trace output is set to CPU execution or Trace output.
Display timestamp
Displays the timestamp of the collected trace data. This option is only available for the RX600 architecture.
Frequency ratio
Selects a frequency division ratio for the timestamp counter. This option is only available for the RX64M group of MCUs. Choose between:
- No frequency division
The frequency of the timestamp counter is equal to the selected clock source frequency.
- 1/16 frequency
The frequency of the timestamp counter is 1/16 of the selected clock source frequency.
- 1/256 frequency
The frequency of the timestamp counter is 1/256 of the selected clock source frequency.
- 1/4096 frequency
The frequency of the timestamp counter is 1/4096 of the selected clock source frequency.
Data to collect
Selects the data trace information to collect. Choose between:
- All data
Collects all data accesses.
- Data trace collection breakpoints
Collects only the data accesses that are triggered by data trace collection breakpoints.
Collected data accesses
Selects which types of memory accesses to collect and display in the Trace window. Choose between:
- Data transfers
Displays trace information collected from data transfers.
- Stack operations
Displays trace information collected from stack operations.
- String operations
Displays trace information collected from string operations.
- Arithmetical operations
Displays trace information collected from arithmetical operations.
- Logical operations
Displays trace information collected from logical operations.
- Bit operations
Displays trace information collected from bit operations.
- FPU
Displays trace information collected from FPU instructions.
- Exceptions
Displays trace information collected from exceptions.