Trace window
What do you want to do?
Learn about:
Learn how to:
Get reference information about the Trace window, see below the line.

The Trace window is available from the C-SPY driver menu.
This window displays the collected trace data.
The contents of the Tracewindow depend on the C-SPY driver you are using.
Trace toolbar
The toolbar in the Trace window contains:
- Enable/Disable

Enables and disables collecting and viewing trace data in this window.
- Clear trace data

Clears the trace buffer. Both the Trace window and the Function Trace window are cleared.
- Toggle source

Toggles the Trace column between showing only disassembly or disassembly together with the corresponding source code.
- Browse

Toggles browse mode on or off for a selected item in the Trace window, see Browsing through trace data.
- Find

Displays a dialog box where you can perform a search, see Find in Trace dialog box.
- Save

Displays a standard Save As dialog box where you can save the collected trace data to a text file, with tab-separated columns.
- Edit Settings

In the C-SPY simulator, this button is not enabled.
For the C-SPY hardware debugger drivers, this button displays the Trace Settings dialog box, see Trace Settings dialog box.
- Progress bar

When a large amount of trace data has been collected, there might be a delay before all of it has been processed and can be displayed. The progress bar reflects that processing.
Display area (in the C-SPY simulator)
This area displays a collected sequence of executed machine instructions. In addition, the window can display trace data.
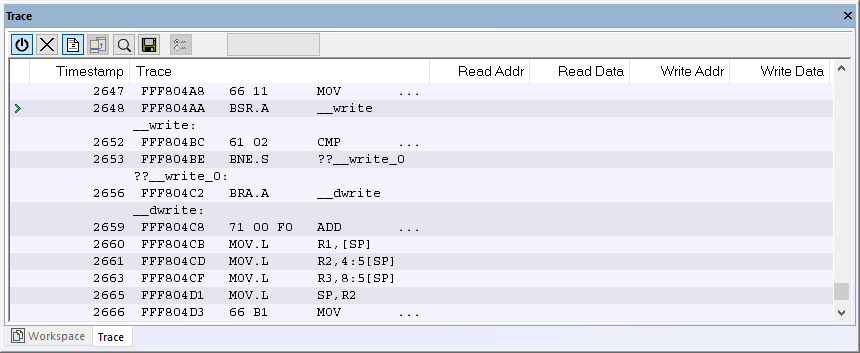
This area contains these columns for the C-SPY simulator:
The leftmost column contains identifying icons to simplify navigation within the buffer:

The yellow diamond indicates the trace execution point, marking when target execution has started.

The right green arrow indicates a call instruction.

The left green arrow indicates a return instruction.

The dark green bookmark indicates a navigation bookmark.

The red arrow indicates an interrupt.

The violet bar indicates the results of a search.
- Timestamp
The number of cycles elapsed to this point.
- Trace
The collected sequence of executed machine instructions. Optionally, the corresponding source code can also be displayed.
- Read Addr, Read Data, Write Addr, Write Data
These columns show reads and writes to memory.
A red-colored row indicates that the previous row and the red row are not consecutive. This means that there is a gap in the collected trace data, for example because trace data has been lost due to an overflow.
Display area (in the C-SPY hardware debugger drivers)
This area displays a sequence of trace data collected from the hardware debugger system. In addition, the window can display the assembler source code for branch trace data.
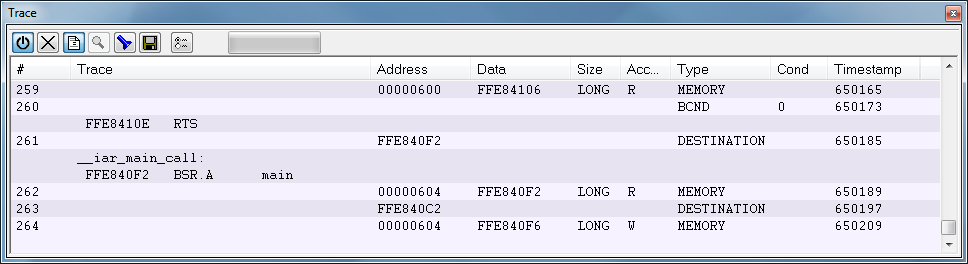
This area contains these columns for the C-SPY hardware debugger drivers:
- #
The frame number for trace data from the hardware debugger system. Restarts from zero each time data is collected.
- Trace
For branch trace, the assembler source code is displayed if this information could be collected.
- Address
The memory address where the data access occurred.
- Data
The data value that was read or written to the address.
- Size
The size of the data read or written. This can be
byte,wordorlong.
- Access
The type of the memory access,
Rfor read orWfor write.
- Type
The type of the collected data, one of:
Memory – Data access
Destination – The destination address of a branch
BCND – Conditional branch information
Lost – The corresponding trace information was lost
Source – The address that was last executed before an interrupt (RX600 series) or where a branch occurred (RX100 and RX200 series)
- Cond
1indicates that the condition for executing a conditional branch instruction was satisfied;0indicates that it was not satisfied.Each row can show information on up to 15 branches.
- Timestamp
The timestamp of the collected data. This column is only available for the RX600 architecture. The timestamp counter frequency varies depending on the RX MCU you are using:
For RX61x and RX62x MCUs when EXTAL x 8 < or = 100 MHz, the timestamp counter frequency is EXTAL x 8.
For RX61x and RX62x MCUs when EXTAL x 8 > 100 MHz, the timestamp counter frequency is EXTAL x 4.
For RX63x and RX64x MCUs using the EXTAL pin, the timestamp counter frequency is 1/2 the selected clock source frequency (or equal to the selected clock source frequency if the division ratio is set to 1:1 by the
SCKCR.ICKbit).For RX63x and RX64x MCUs not using the EXTAL pin, the timestamp counter frequency is equal to the selected clock source frequency. For the RX64M MCUs, you can use the Frequency ratio option in the Trace Settings dialog box to decrease this frequency.
An italicized row indicates that the previous row and the italicized row are not consecutive. This means that there is a gap in the collected trace data, for example because trace data has been lost due to an overflow.
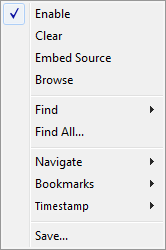
Context menu
This context menu is available:
Note
The contents of this menu are dynamic and depend on which features that your combination of software and hardware supports. However, the list of menu commands below is complete and covers all possible commands. Note that the shortcuts to the submenu commands do not use the Ctrl key.
These commands are available:
- Enable
Enables and disables collecting and viewing trace data in this window.
- Clear
Clears the trace buffer. Both the Trace window and the Function Trace window are cleared.
- Embed source
Toggles the Trace column between showing only disassembly or disassembly together with the corresponding source code.
- Browse
Toggles browse mode on or off for a selected item in the Trace window, see Browsing through trace data.
- Find>Find (F)
Displays a dialog box where you can perform a search in the Trace window, see Find in Trace dialog box. The contents of the window will scroll to display the first match.
- Find>Find Next (G)
Finds the next occurrence of the specified string.
- Find>Find Previous (Shift+G)
Finds the previous occurrence of the specified string.
- Find>Clear (Shift+F)
Removes all search highlighting in the window.
- Find All
Displays a dialog box where you can perform a search in the Trace window, see Find in Trace dialog box. The search results are displayed in the Find in Trace window—available by choosing the View>Messages command, see Find in Trace window.
- Navigate>After Current Loop (L)
Identifies the selected program counter and scans the trace data forward, collecting program counters, until it finds the same address again. It has now detected a loop. (Loops longer than 1000 instructions are not detected.) Then it navigates forward until it finds a program counter that is not part of the collected set. This is useful for navigating out of many iterations of an idle or polling loop.
- Navigate>Before Current Loop (Shift+L)
Behaves as After Current Loop, but navigates backward out of the loop.
- Navigate>After Current Function (U)
Navigates to the next unmatched return instruction. This is similar to stepping out of the current function.
- Navigate>Before Current Function (Shift+U)
Navigates to the closest previous unmatched call instruction.
- Navigate>Next Statement (S)
Navigates to the next instruction that belongs to a different C statement than the starting point. It skips function calls, i.e. it tries to reach the next statement in the starting frame.
- Navigate>Previous Statement (Shift+S)
Behaves as Next statement, but navigates backward to the closest previous different C statement.
- Navigate>Next on Same Address (A)
Navigates to the next instance of the starting program counter address, typically to the next iteration of a loop.
- Navigate>Previous on Same Address (Shift+A)
Navigates to the closest previous instance of the starting program counter address.
- Navigate>Next Interrupt (I)
Navigates to the next interrupt entry. (To then find the matching interrupt exit, follow up with After Current Function.)
- Navigate>Previous Interrupt (Shift+I)
Navigates to the closest previous interrupt entry.
- Navigate>Next Execution Start Point (E)
Navigates to the next point where the CPU was started, for example places where the application stopped at breakpoints, or was stepped.
- Navigate>Previous Execution Start Point (Shift+E)
Navigates to the closest previous point where the CPU was started.
- Navigate>Next Discontinuity (D)
Navigates to the next discontinuity in the trace data.
- Navigate>Previous Discontinuity (Shift+D)
Navigates to the closest previous discontinuity in the trace data.
- Bookmarks>Toggle (+)
Adds a new navigation bookmark or removes an existing bookmark.
- Bookmarks>Goto Next (B)
Navigates to the next navigation bookmark.
- Bookmarks>Goto Previous (Shift+B)
Navigates to the closest previous navigation bookmark.
- Bookmarks>Clear All
Removes all navigation bookmarks.
- Bookmarks>location (0–9)
At the bottom of the submenu, the ten most recently defined bookmarks are listed, with a shortcut key each from 0–9.
- Timestamp>Set as Zero Point (Z)
Sets the selected row as a reference “zero” point in the collected sequence of trace data. The count of rows in the Trace window will show this row as
0and recalculate the timestamps of all other rows in relation to this timestamp.
- Timestamp>Go to Zero Point (Shift+Z)
Navigates to the reference “zero” point in the collected sequence of trace data (if you have set one).
- Timestamp>Clear Zero Point
Removes the reference “zero” point from the trace data and restores the original timestamps of all rows.
- Save
Displays a standard Save As dialog box where you can save the collected trace data to a text file, with tab-separated columns.