Connecting the target system
Power-up your I-jet Trace probe
Connect I-jet Trace to the host computer using the USB3 micro cable or any other compatible high-quality USB3 cable.
Connect I-jet Trace to the target board using the cable that matches the target board connector (MIPI-20, MIPI-10, or Mictor-38). If an ARM-20 connector is used, you must first plug the ADA-MIPI20-ARM20 adapter into the JTAG connector.
Note
No harm is done if the above order is reversed.
Warning
To prevent damage, the target GND and the USB host GND must be at the same level. When hot-plugging, make sure that the PC and the target board power supply are connected to the same grounded wall outlet or a common grounded desktop power strip.
Supplying target power from I-jet Trace
I-jet Trace can only supply power to the target board through the MIPI-20 and ARM-20 connections. The Mictor interface does not facilitate powering targets from the debug probes.
I-jet Trace CM can supply a maximum of 4.66 V at 200 mA when using USB3 ports without the need of plugging in an external 5 V DC power supply.
I-jet Trace A/R/M must use the supplied (5 V DC at 2 A) power adapter to power a target board. When it is not powering the target, I-jet Trace A/R/M does not need the external power supply as long as it is connected to the USB3 port.
Power up your evaluation board
If you have an evaluation board that is prepared for it, you can power the board via I-jet Trace through pin 19 on the ARM-20 connector, or pin 11/13 on the small MIPI-20 connector. Target power of up to 400 mA can be supplied from I-jet Trace with overload protection. Most of the IAR KickStart Kits contain an evaluation board that can be powered this way. Make sure that the power jumper found on most of these boards matches your setup.
Note
The target board will only get power via I-Jet Trace when you choose the Download and Debug or Debug without Downloading command in C-SPY, and not before.
Note
The only way to use the power debugging feature is to power up your evaluation board via the probe.
Calibration
When the debug system powers up, the trace probe evaluates the signal quality of the trace data lines and tries to find the best sampling point for the trace data. The calibration result is displayed in the Debug Log window, as a visual pattern of ASCII characters.
The overall detected quality of the calibration run will be given as q=n, the higher, the better. It is determined by the data line with the smallest horizontal eye opening. A numbered scale corresponds to one clock phase of the detected trace clock, divided into 64 time slots. The trace clock frequency is also stated in the debug output, as f=nMHz.
Character | Description |
|---|---|
| All data samples in this time slot are as expected. |
| The calibration center of the data line, that is, the best sampling point found by the probe. |
| The calibration center of the data line, but also the point closest to the median for the entire calibration run. |
| 0%..9% of the data samples have errors. (0 means that the number of errors rounds down to zero, but there are errors.) |
| 10% or more of the data samples have errors. |
| All data samples have errors, and a percentage cannot be computed. |
| Cannot synchronize properly—no pattern is found. (The second stage of pattern detection.) |
| No zero pattern found. (The first stage of pattern detection.) |
| The default position of the trace clock sampling edge. This is just for orientation and for showing differences in delay of each data line. |
This is an example of a calibration run:
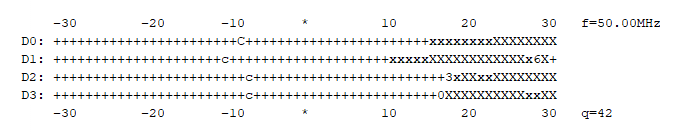
In this example, 42 out of 64 possible slots are of good quality, which should not cause any data errors during trace run. Successful trace data sampling is generally possible with a quality of at least 6.
If you need help deciphering the trace calibration log, contact IAR Technical Support.