Timeline window—Events graph
What do you want to do?
Learn about:
Learn how to:
Get related information:
Get reference information about the Timeline window for the Events graph, see below the line.

The Timeline window is available from the C-SPY driver menu during a debug session.
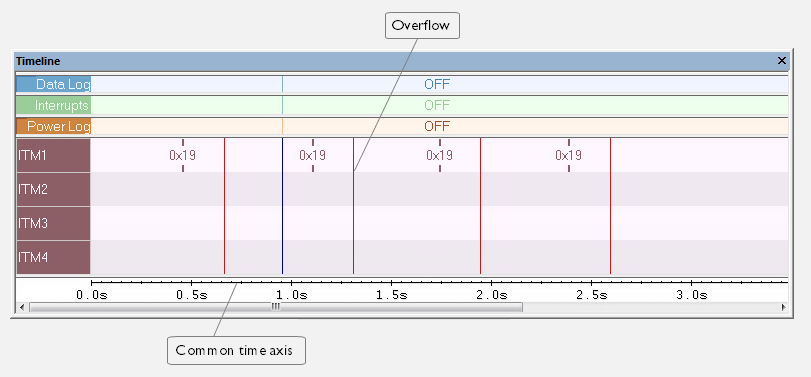
This window displays trace data represented as different graphs, in relation to a shared time axis.
The Events graph displays the events produced when the execution passes specific positions in your application code.
Note
There is a limit on the number of saved logs. When this limit is exceeded, the oldest entries in the buffer are erased.
Context menu
This context menu is available:
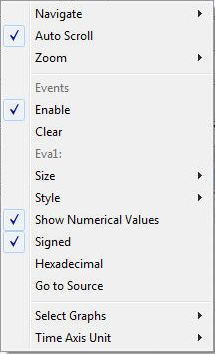
These commands are available:
- Navigate
Commands for navigating the graph(s). Choose between:
Next moves the selection to the next relevant point in the graph. Shortcut key: right arrow.
Previous moves the selection backward to the previous relevant point in the graph. Shortcut key: left arrow.
First moves the selection to the first data entry in the graph. Shortcut key: Home.
Last moves the selection to the last data entry in the graph. Shortcut key: End.
End moves the selection to the last data in any displayed graph, in other words the end of the time axis. Shortcut key: Ctrl+End.
- Zoom
Commands for zooming the window, in other words, changing the time scale. Choose between:
Zoom to Selection makes the current selection fit the window. Shortcut key: Return.
Zoom In zooms in on the time scale. Shortcut key: +
Zoom Out zooms out on the time scale. Shortcut key: –
10ns, 100ns, 1us, etc makes an interval of 10 nanoseconds, 100 nanoseconds, 1 microsecond, respectively, fit the window.
1ms, 10ms, etc makes an interval of 1 millisecond or 10 milliseconds, respectively, fit the window.
10m, 1h, etc makes an interval of 10 minutes or 1 hour, respectively, fit the window.
- Enable
Toggles the display of the graph on or off. If you disable a graph, that graph will be indicated as OFF in the window. If no data has been collected for a graph, no data will appear instead of the graph.
- Clear
Deletes the log information. Note that this will also happen when you reset the debugger.
- Variable
The name of the channel for which the Events-specific commands below apply. This menu command is context-sensitive, which means it reflects the channel in the Events graph you selected in the Timeline window (one of up to four).
- Viewing Range
Displays a dialog box, see Viewing Range dialog box.
- Style
Selects the style of the graph. Choose between:
Bars, displays a vertical bar for each log.
Columns, displays a column for each log.
Levels, displays the graph with a rectangle for each log, optionally color-filled.
Linear, displays the graph as a thin line between consecutive logs.
Note that all styles are not available for all graphs.
- Signed
Toggles between displaying the selected value as a signed or unsigned number. Note that this setting also affects the log window.
- Hexadecimal
Toggles between displaying the selected value in decimal or hexadecimal format. Note that this setting also affects the log window.