Simulator menu
When you use the simulator driver, the Simulator menu is added to the menu bar:
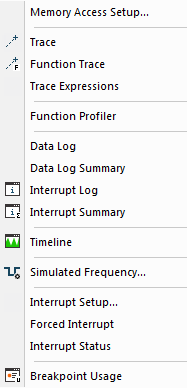
Menu commands
These commands are available on the menu:
- Memory Configuration

Displays a dialog box where you configure C-SPY to match the memory of your device, see Memory Configuration dialog box for the C-SPY simulator.
- Trace

Opens a window which displays the collected trace data, see Trace window.
- Function Trace

Opens a window which displays the trace data for function calls and function returns, seeFunction Trace window.
- Function Profiler
Opens a window which shows timing information for the functions, see Function Profiler window.
- Data Log
Opens a window which logs accesses to up to four different memory locations or areas, see Data Log window.
- Data Log Summary
Opens a window which displays a summary of data accesses to specific memory location or areas, see Data Log Summary window.
- Interrupt Log

Opens a window which displays the status of all defined interrupts, see Interrupt Log window.
- Interrupt Log Summary

Opens a window which displays a summary of the status of all defined interrupts, see Interrupt Log Summary window.
- Timeline

Opens a window which gives a graphical view of various kinds of information on a timeline, see The application timeline.
- Simulated Frequency

Opens the Simulated Frequency dialog box where you can specify the simulator frequency used when the simulator displays time information, for example in the log windows. Note that this does not affect the speed of the simulator. For more information, see Simulated Frequency dialog box.
- Interrupt Configuration
Opens a window where you can configure C-SPY interrupt simulation, see Interrupt Configuration window.
- Available Interrupts
Opens a window with an overview of all available interrupts. You can also force an interrupt instantly from this window, see Available Interrupts window.
- Interrupt Status
Opens a window from where you can instantly trigger an interrupt, see Interrupt Status window.
- Breakpoint Usage

Displays a window which lists all active breakpoints, see Breakpoint Usage window.