C-SPY Debugger main window
What do you want to do?
Learn about:
Learn how to:
Get reference information about the C-SPY Debugger main window, see below the line.

When you start a debug session, these debugger-specific items appear in the main IAR Embedded Workbench IDE window:
A dedicated Debug menu with commands for executing and debugging your application
Depending on the C-SPY driver you are using, a driver-specific menu, often referred to as the Driver menu in this documentation. Typically, this menu contains menu commands for opening driver-specific windows and dialog boxes.
A special debug toolbar
Several windows and dialog boxes specific to C-SPY
The C-SPY main window might look different depending on which components of the product installation you are using.
Debug menu
The Debug menu is available during a debug session. The Debug menu provides commands for executing and debugging the source application. Most commands are also available as icon buttons on the debug toolbar.
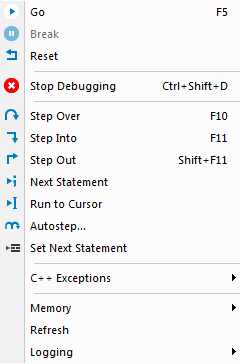
These commands are available:
- Go (F5)

Executes from the current statement or instruction until a breakpoint or program exit is reached.
- Break

Stops the application execution.
- Reset

Resets the target processor. Click the drop-down button to access a menu with additional commands.
Enable Run to 'label', where
labeltypically ismain. Enables and disables the project option Run to without exiting the debug session. This menu command is only available if you have selected Run to in the Options dialog box.Reset strategies, which contains a list of reset strategies supported by the C-SPY driver you are using. This means that you can choose a different reset strategy than the one used initially without exiting the debug session. Reset strategies are only available if the C-SPY driver you are using supports alternate reset strategies.
- Stop Debugging (Ctrl+Shift+D)

Stops the debugging session and returns you to the project manager.
- Step Over (F10)

Executes the next statement, function call, or instruction, without entering C or C++ functions or assembler subroutines.
- Step Into (F11)

Executes the next statement or instruction, or function call, entering C or C++ functions or assembler subroutines.
- Step Out (Shift+F11)

Executes from the current statement up to the statement after the call to the current function.
- Next Statement

Executes directly to the next statement without stopping at individual function calls.
- Run to Cursor

Executes from the current statement or instruction up to a selected statement or instruction.
- Autostep

Displays a dialog box where you can customize and perform autostepping, see Autostep settings dialog box.
- Set Next Statement

Moves the program counter directly to where the cursor is, without executing any source code. Note, however, that this creates an anomaly in the program flow and might have unexpected effects.
- C++ Exceptions>Break on Throw
Specifies that the execution shall break when the target application executes a
throwstatement.To use this feature, your application must be built with the option Library low-level interface implementation selected and the language option C++ With exceptions.
This menu command is not supported by your product package.
- C++ Exceptions>Break on Uncaught Exception
Specifies that the execution shall break when the target application throws an exception that is not caught by any matching
catchstatement.To use this feature, your application must be built with the option Library low-level interface implementation selected and the language option C++ With exceptions.
This menu command is not supported by your product package.
- Memory>Save
Displays a dialog box where you can save the contents of a specified memory area to a file, see Memory Save dialog box.
- Memory>Restore
Displays a dialog box where you can load the contents of a file in, for example Intel-extended or Motorola s-record format to a specified memory zone, see Memory Restore dialog box.
- Refresh
Refreshes the contents of all debugger windows. Because window updates are automatic, this is needed only in unusual situations, such as when target memory is modified in ways C-SPY cannot detect. It is also useful if code that is displayed in the Disassembly window is changed.
- Logging>Set Terminal I/O Log file
Displays a dialog box where you can choose to log simulated target access communication to a file. You can select the destination of the log file. See Terminal I/O Log File dialog box.